“Data is the new gold” - Eurocommissionary Neelie Kroes already mentioned years ago that Europe could earn 70 billion euros on a yearly basis by opening non-public datasets.
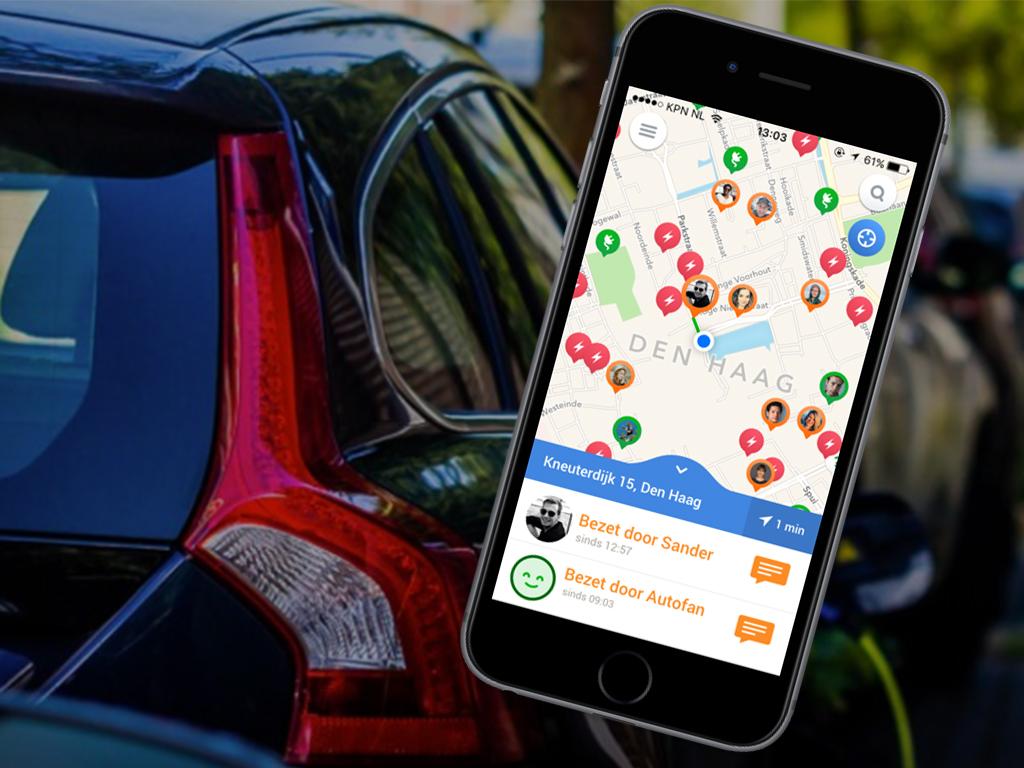
Since then the open data challenges popped up like daisies, with lots of new services and apps as result. With the right data, making strategic decisions becomes easier and we can literally map out complex questions in order to find the best answers or solutions. This is especially interesting for big cities. How can you solve the parking problems in metropolitan areas of the city, for example? Open data can help you out with these questions!
Modern mobility
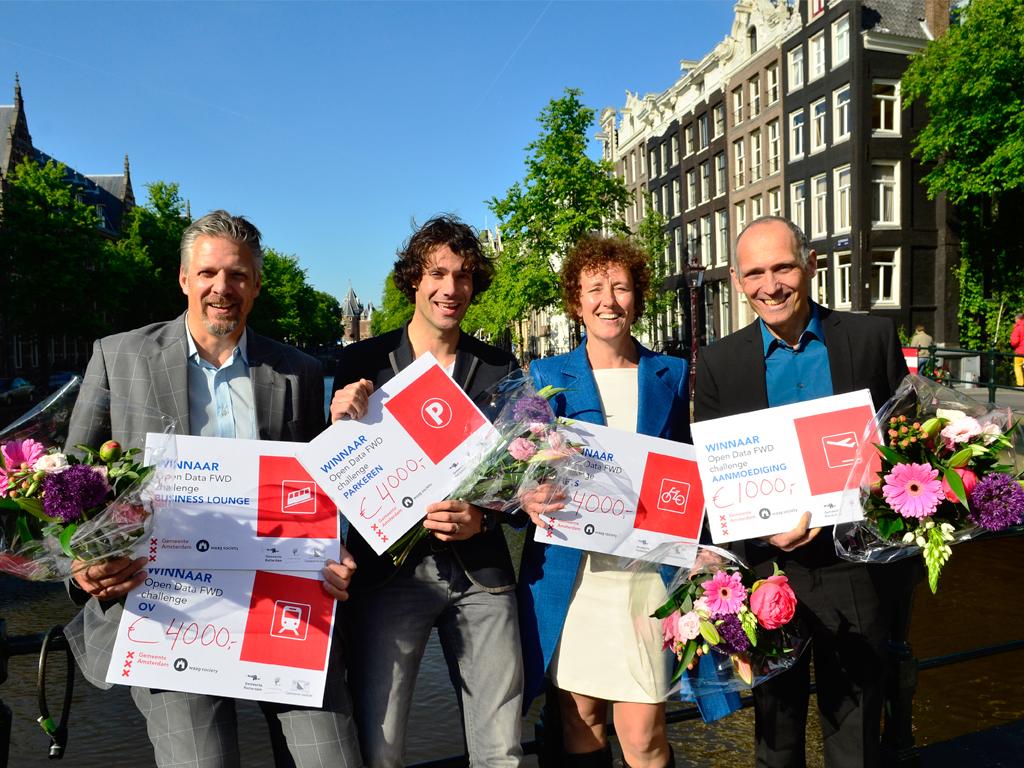
Reasons enough to investigate how we can improve mobility by using modern technology. The use of open data plays a relevant and important role in this case. And that is exactly why the Municipality of Amsterdam and Waag joined forces in order to work together and start the Open Data FWD challenge, with a focus on three different themes: Parking, Cycling and Public Transport. In this project, we want to connect concrete urban issues concerning mobility with digital solutions.
On February 13th, the kick-off of this challenge took place. During the kick-off, speakers from different backgrounds discussed specific issues and potential digital solutions. One of them was Elizabeth Turner, expert in creating visualizations with open data.
What are your experiences working with open data?
"As a designer I work a lot with data-visualisation and infographics. And I'm the business owner of Iconomical, a company that creates data visualizations and interactive user experiences for communication purposes. We enable people who have data, to visualise and communicate their data to their audience. Governmental data is one of our specialties. The challenge is to make this kind of data understandable and transparent. Its no rocket science, but we focus on using relatively available technology to access and communicate the data. Making data understandable is the key."
Could you give one best practice?
"Make things visible! I started out as a web designer and have been fascinated by how visualisation can support lots of processes."
Did you experience obstacles or barriers while working on an open data application?
"We experienced all sorts of obstacles! Since open data comes from many diverse sources, it's always a surprise what kind of quality you will get. You have to tackle the dataset with different formats and versions. Another totally different issue, is that people are a bit nervous about opening up data. Sometimes, there is a trust issue, which is unnecessary, that slows down the process."
Do you have a favourite visualization of open data?
"I’m always referring to Gapminder. Check the Gapminder world and then their Map, and you will know what I am talking about. It’s not a super fancy data visualisation, but it gives you a view on the entire world. It always makes me feel good to look at the issue from such a perspective."
Next time we will interview another Open Data FWD speaker, David Demper.
#OpenDataFWD