Big data: what can we do with it en what does it say about us? How are those vast amounts of data organised and communicated? How can we visualise big data and make large complex processes more tangible? In the exhibition Data Aesthetics – The Interactive Art artists, designers and activists researched and visualised the potential of big data.
Big data can be of social, cultural, ecological or economical origin. What are the patterns that can be discovered, and how? In our complex society it can be difficult to relate different types of information to each other. Additionally, we can wonder what sort of knowledge does all this data lead to and who owns the end result. Computer generated analysis based on big data play a greater role in scientific research. Predictions about climate, epidemics and traffic can be beneficial to humans. Simultaneously, the misuse of power and private data is causing unrest and debate in society.
The exhibition 2016
In the exhibition Data Aesthetics – The Interactive Art works of art could be found that showed us the diverse impacts of big data on business, knowledge and society. Questions about the various forms of big data, the ethics, power and aesthetics were raised.
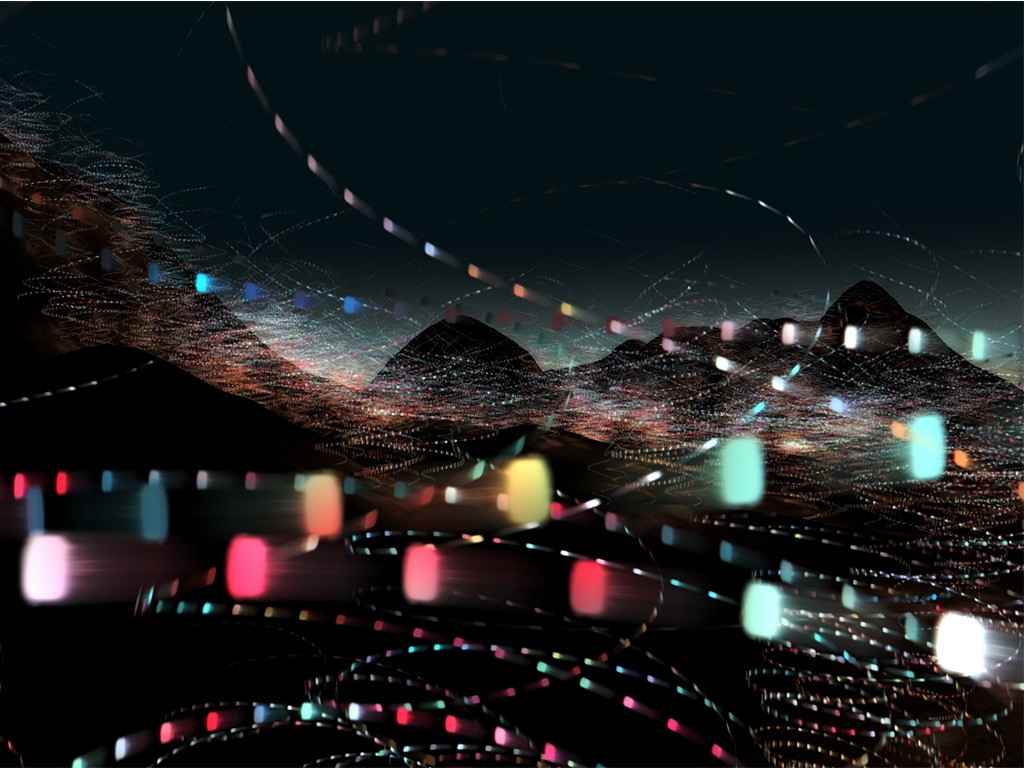
Ivar Veermae showed us that the metaphorical cloud of Google happens to be sitting in a tiny village in Belgium. Lev Manovic visualised the manifold of all images existing in publically accessible databases of a short piece of Broadway Manhattan. Paolo Cirio made visible those who can be held responsible for limiting our digital freedom. Jonas Lund designed algorithms to account who are the hundred best curators of the world. Roos Groothuizen produced your Google passport, informing you how much Google is informed about you. Edit Kaldor created a public database with the powerless and for the powerless, asking us who might have the algorithm here. Frank Kresin and Daniel Buzzo made us experience big data mentally. Jaromil Rojo showed us poetry of both the algorithmic and manual translations of ‘files’. Boredomresearch showed us the beauty of the way malaria spreads.
Partners in this project were: Mondriaan Fund, OBA Amsterdam, SIGMM, University of Amsterdam - Informatics Institute, TU Delft, ETH Zurich and The Things Network.