Als je geïnteresseerd bent in cartografie, doe dan mee aan deze praktische hackersavond waarop we samen kaarten maken. Maptime is hands-on, dus vergeet niet om je laptop mee te nemen! Alle niveaus zijn welkom.
Maptime #4: Geopolitics & Borders (and D3.js)
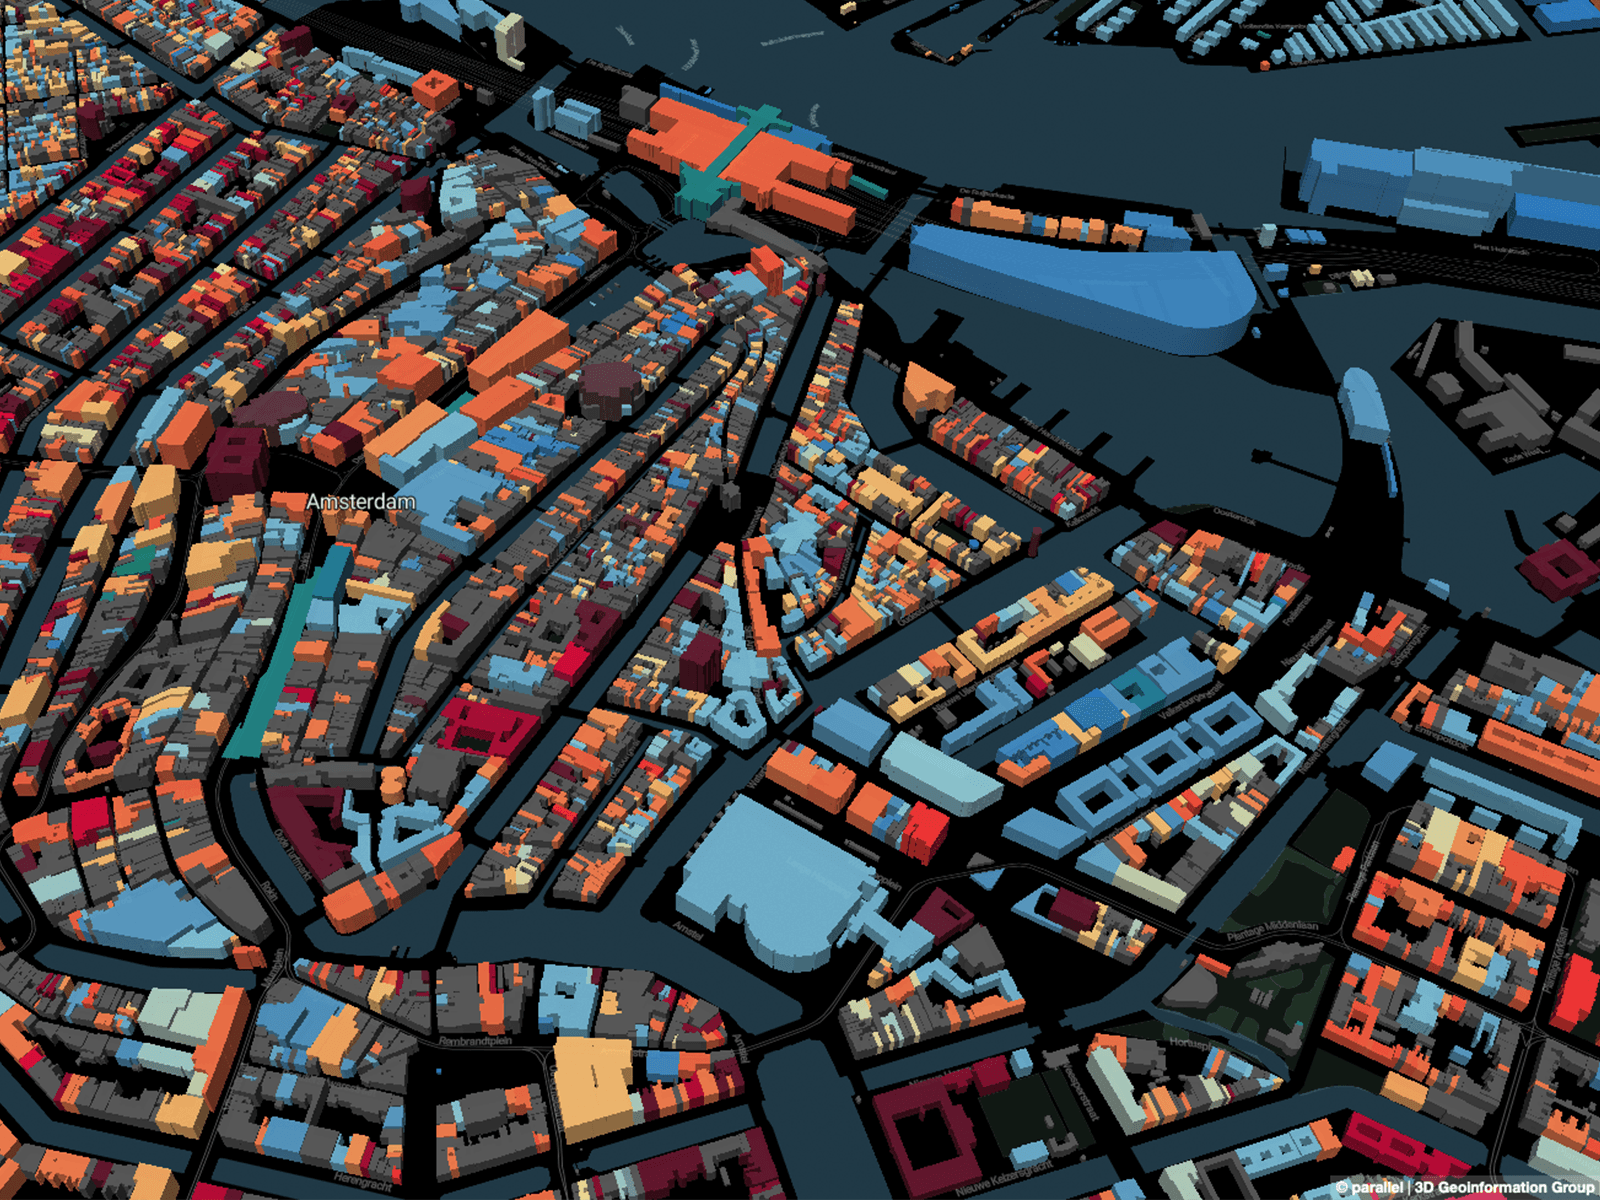
Maps are by no means objective: mapmakers leave things out, remove details, and exaggerate certain other map features. Maybe this does not matter too much when Google Maps decides to not display your favorite restaurant on the map (or does it?), but it can change the lives of people when it comes to the exact location of a county's border. Maptime #4 is about borders: what are they, what problems do they cause, and finally, how to make a geopolitical map.
Maptime #4 will start with a talk from Prof. dr. Henk van Houtum, Research Professor Geopolitics of Borders, University of Bergamo & Associate Professor Geopolitics and Political Geography of the Radboud University Nijmegen and Head of the Nijmegen Centre for Border Research (NCBR). Van Houtum will talk about borders and their role in mapmaking. Please have a look at his personal website for more information.
Next, photographer Hans van der Meer talks about his project Document Nederland 2014: The Netherlands - Belgium. Document Nederland is a yearly exhibition, commissioned by The Rijksmuseum.
Finally, we'll work on an animated map of Europe's changing borders throughout the centuries, using D3.js. D3.js is an amazing JavaScript data visaulization library, which can also display and manipulate cartographic data. To see how powerful D3 can be, please have a look at the gallery on D3's homepage. All this power comes at a price, of course: it takes a little while to fully understand how D3 works, especially if you've never used JavaScript (or another programming language) before. For Maptime #4, I'll work on an step-by-step tutorial, to make sure everyone will be able to create a functional animating map, the tutorial will cover how to get the source data, how to export the data we need, how to create a simple HTML web page and use D3 and CSS to visualize and animate the map.
Over Maptime AMS
Maptime Amsterdam is een maandelijkse avond waar we kaarten hacken bij Waag. We ontmoeten elkaar een keer per maand op woensdag om 18.30 uur om te werken aan kaarten, kennis te delen over ruimtelijke data en elkaar de nieuwste cartografische hulpmiddelen te leren.
Maptime is, letterlijk, tijd voor cartografie. Onze missie is om (digitale) cartografie toegankelijk te maken voor iedereen die geïnteresseerd in samenwerken en leren, ontdekken, en kaarten maken met behulp van mapping tools en technologie. Deze open leeromgeving voor alle kennisniveaus biedt bewust steun aan de beginner. Maptime is zowel flexibel als gestructureerd, een plek voor workshops, lopende projecten met een gemeenschappelijk doel, en onafhankelijke/gezamenlijke werktijd.
Inspiratie voor Maptime komt van zowel hackerbijeenkomsten als breiclubjes, waar mensen samen maken en leren. Ons doel is om deze ruimte open te stellen. Je kan aan je eigen projecten werken, gewoon langskomen en een praatje maken of vragen stellen. Van beginner tot expert, we leren allemaal, dus waarom niet samen?
Maptime is hands-on, dus vergeet niet om je laptop mee te nemen! Alle niveaus zijn welkom.