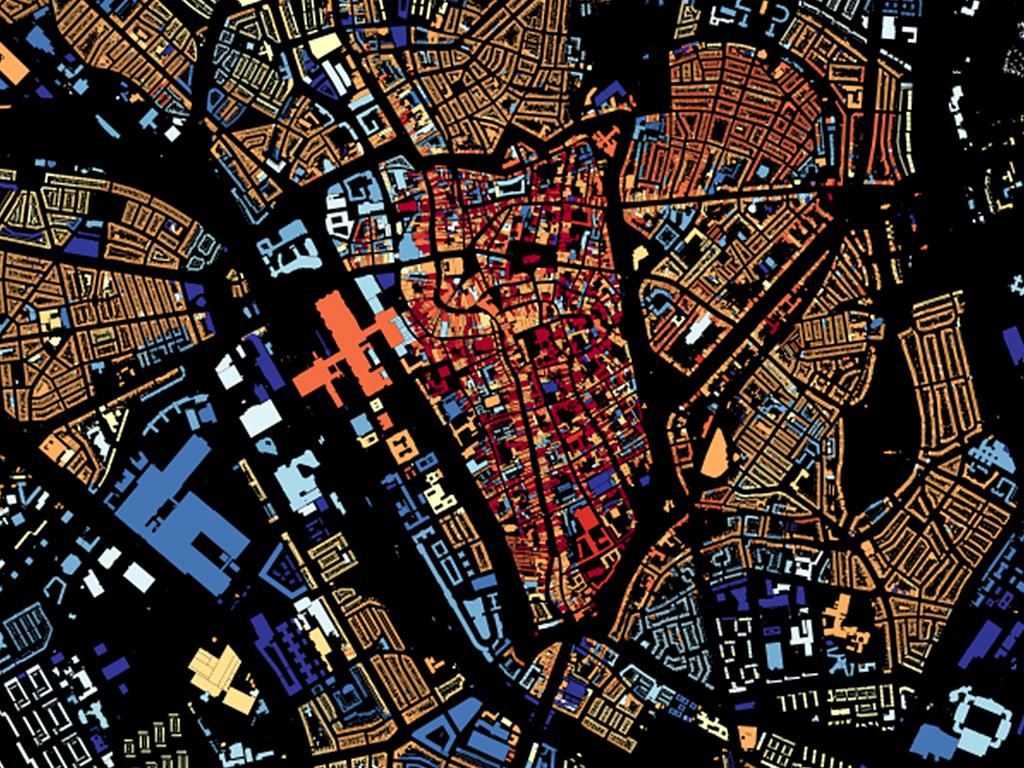
At the Smart City Conference in May 2014, a beta version of the City Dashboard Amsterdam was presented, that showed realtime data from the city.
Amsterdam has released quite a lot of data. Census information, traffic densities, public transport schedules and sustainability readings. These data are published on several websites, in various formats. As part of the City Service Development Kit (CitySDK) and the Open Data Exchange projects, a lot of effort has been made to make data sets available in realtime.
A true treasure, that contains an enormous insight in what make the city tick. Unfortunately, these raw data are hard to ‘read’. Considerable skills are needed to understand the data files, and infer their hidden meanings. Therefore, we have taken the metaphor of the Key Performance Indicators - and devised City Performance Indicators. These condense the data and we visualized them in easy to read dashboard.
The City Dashboard Amsterdam is no longer operative.


