Overcrowded bicycle stands, driving circles in search of a parking spot in the city centre and waiting on trains that are delayed for whatever reason. These are all examples which probably sound familiar to you (if not, what's your secret?) The mobility issues are increasing more and more, especially in the downtown areas.
What are the fastest, most simple and effective ways of traveling from point A to B in an constantly growing society. It's a complex theme where many people from different industries are working on. Every person who steps out of his front door automatically deals with 'mobility'. Let's face the facts, in the Netherlands alone, we're talking about several million people.
Modern mobility
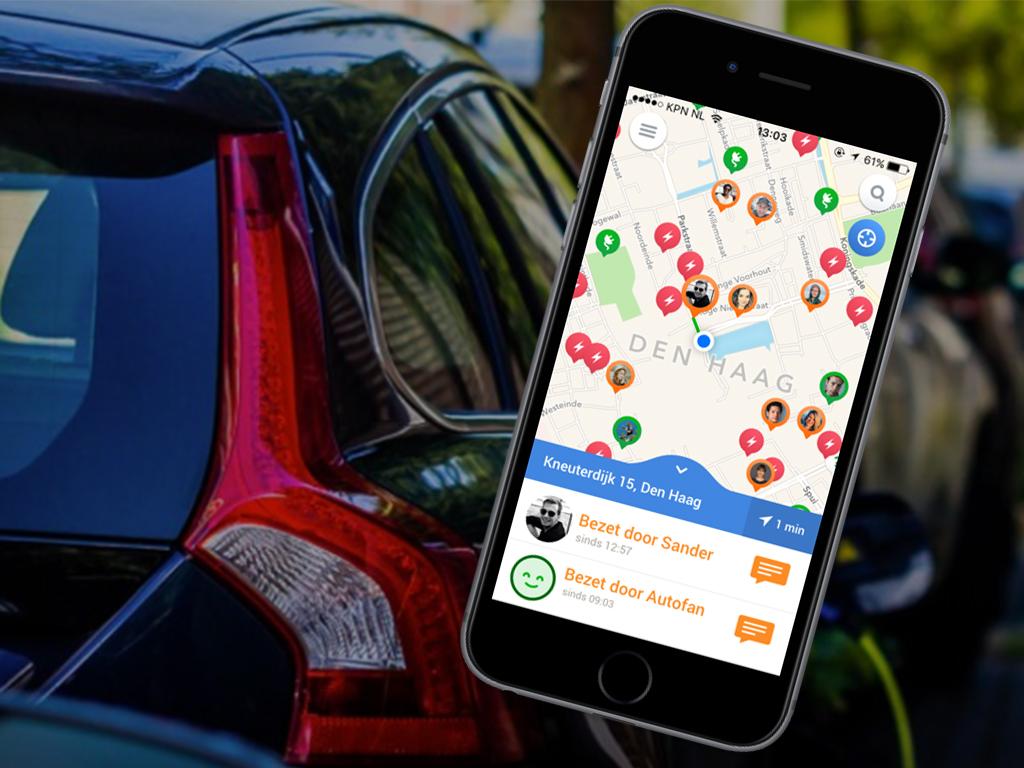
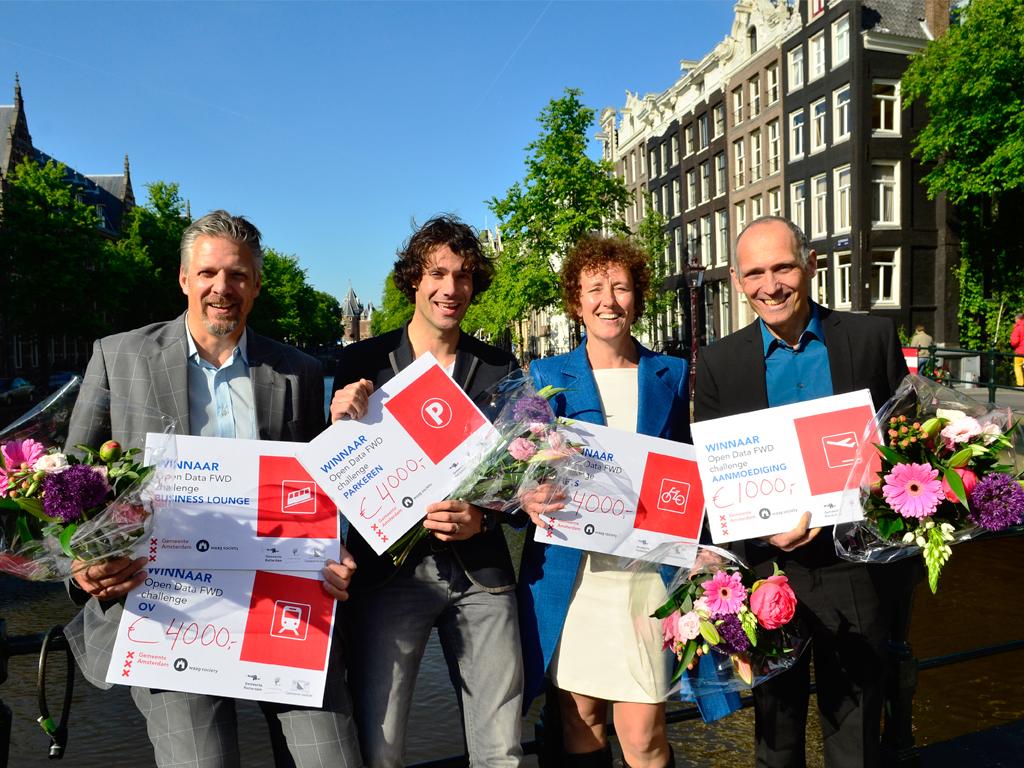
Reasons enough to investigate how we can improve mobility by using modern technology. The use of open data plays a relevant and important role in this case. And that is exactly why DIVV and Waag joined forces in order to work together and start the Open Data FWD challenge. The focus is on three different theme's: Parking, Cycling and Public Transport. In this project, we want to connect concrete urban issues concerning mobility with digital solutions. On February 13th the Open Data FWD kick-off took place.
During the kick-off, speakers from different backgrounds discussed specific issues and potential digital solutions. One of them was Andrew Byrd. Time for a small-talk with the man behind the open data consultanc agency Conveyal.
Could you give some expamples of best practices?
"Best practices, including some things we've done (and still do) are in my opinion:
- Decision-making: With our software we support solving issues by comparing different scenarios. This helps with making decisions about budget cuts, changes and analysis.
- Communication: Our products help with external communication. It provides citizens with a simple way to understand the transportation construction. By doing so, you can also help transit agencies, the local government and construction to communicate to the public. We successfully did this in New Zealand and New York."
Did you experience obstacles or barriers whilst working on an open data application?
"Actually, open data removed all the obstacles! Open data enabled lots of practices, which were impossible before. It also created a lot of motivation among developers, because once you have the data, you can do a lot with it."
Do you have a favourite visualization of open data / societal data?
- Graph Server
A visualisation showing the shortest path from A to B within certain areas. The path is influenced by time, the visualisation that is generated looks like growing trees.
- Open Trip Planner
A detailed visualisation showing the possible area to reach from one point in Paris, within a certain time frame.
- NYC Region
A visualisation showing the possible area to reach by public transportation from one point in New York. It changes per time and gives a clear view of the possibilities by public transportation.
Next time we will interview another Open Data FWD speaker, Elizabeth Turner.