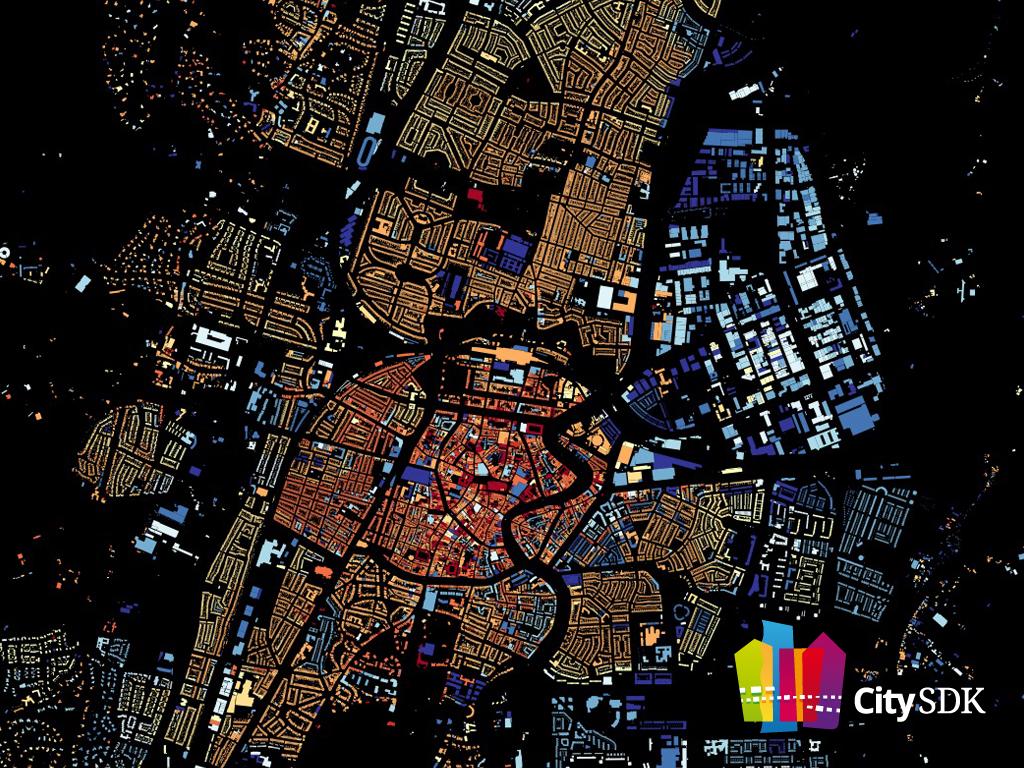
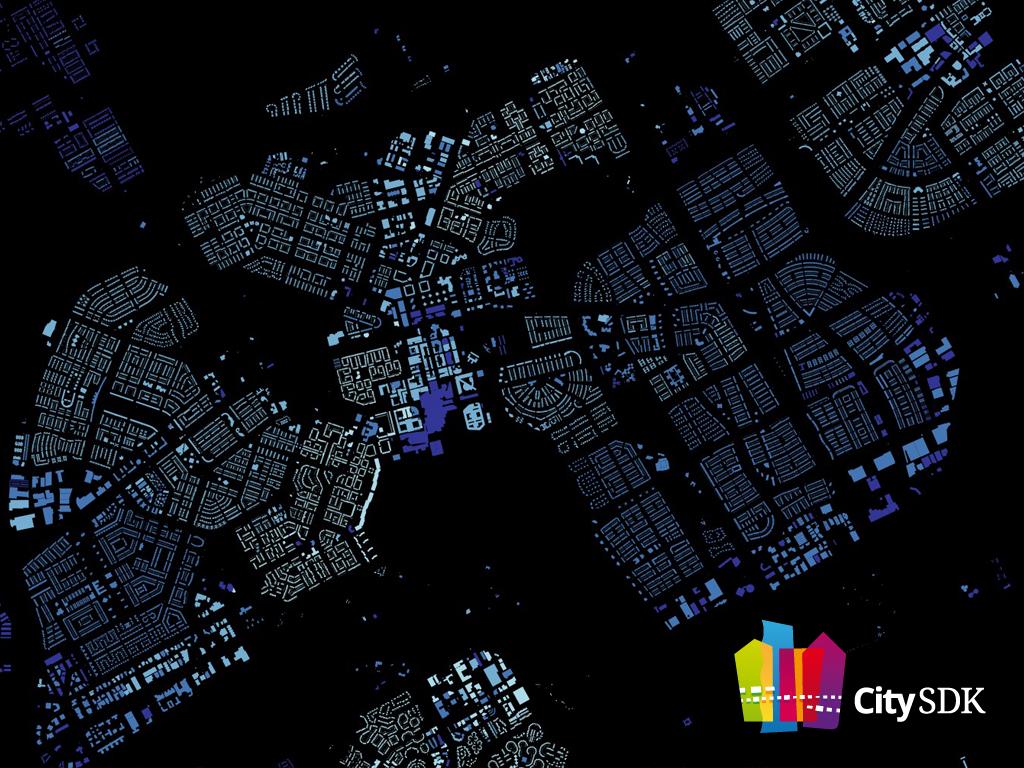
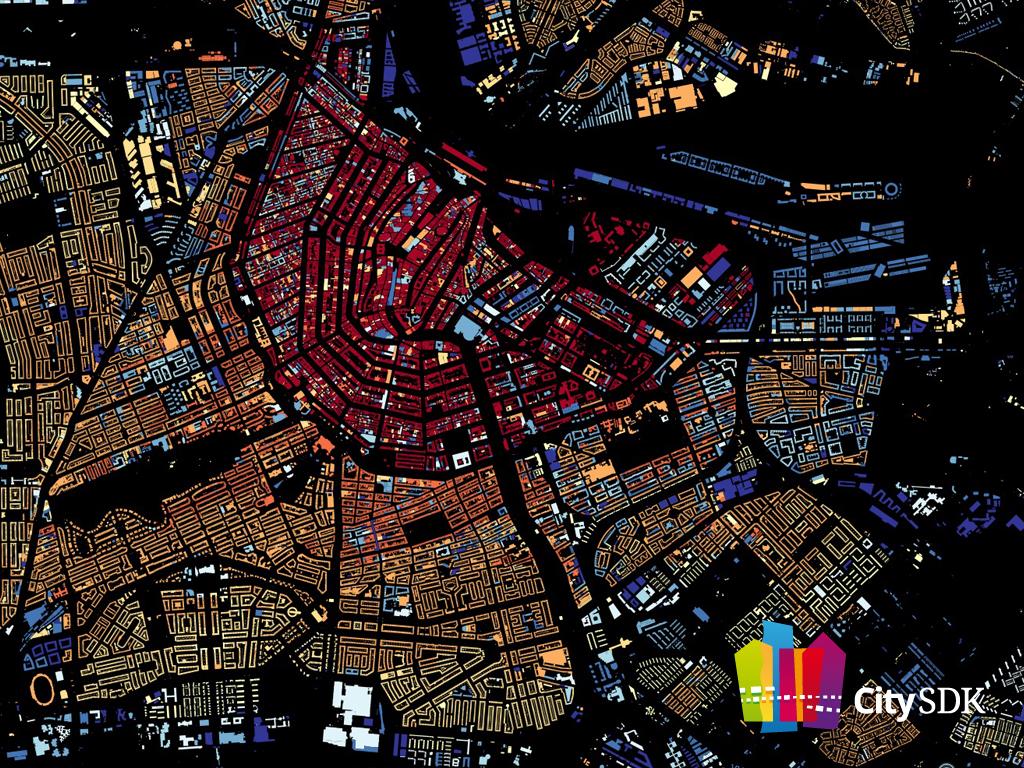
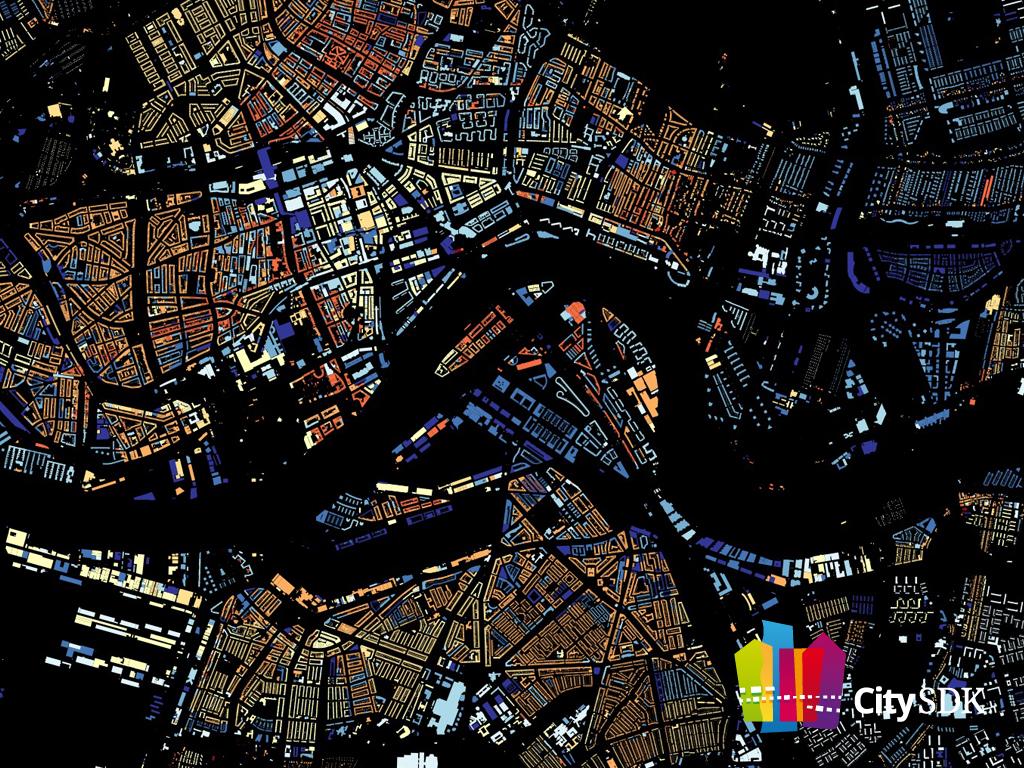
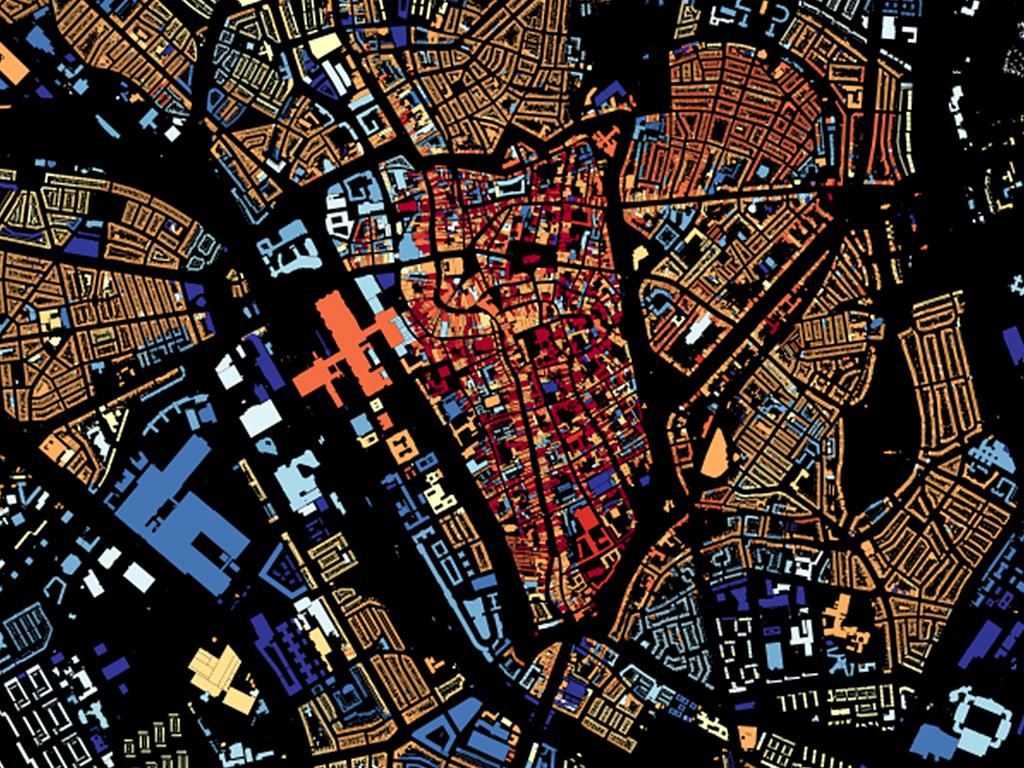
Bert Spaan, developer at Waag, has made a map within the framework of the European Smart CitySDK project to show all 9,866,539 buildings in The Netherlands, shaded according to their year of construction. This give us a complete new image of the country and clearly shows the age of cities, whether they are still relatively young (in blue, built after 1960) or very old (in red). A nice example is a city like ;Haarlem, of which the old inner city clearly lights up, or Almere, covered in blues as it is built in recent times.
The data for this map comes from the so-called BAG resgister, in which all municipal data of adresses and buildings in he Netherlands is collected. This visualization is a good example of what linked open data can do!
CitySDK (in full City Service Development Kit) aims to define services that can help open up data in the fields of Participation, Mobility and Tourism in various cities in Europe. Within this project, Waag is responsible for the domain Mobility. Software developers can find al the information, demos and links to Github at the developers website: citysdk.waag.org
