If you are interested in mapmaking, join us for a hands-on hack night where we will create maps together. Maptime is hands-on, so don't forget to bring your laptop! All skill levels are welcome.
Maptime #4: Geopolitics & Borders (and D3.js)
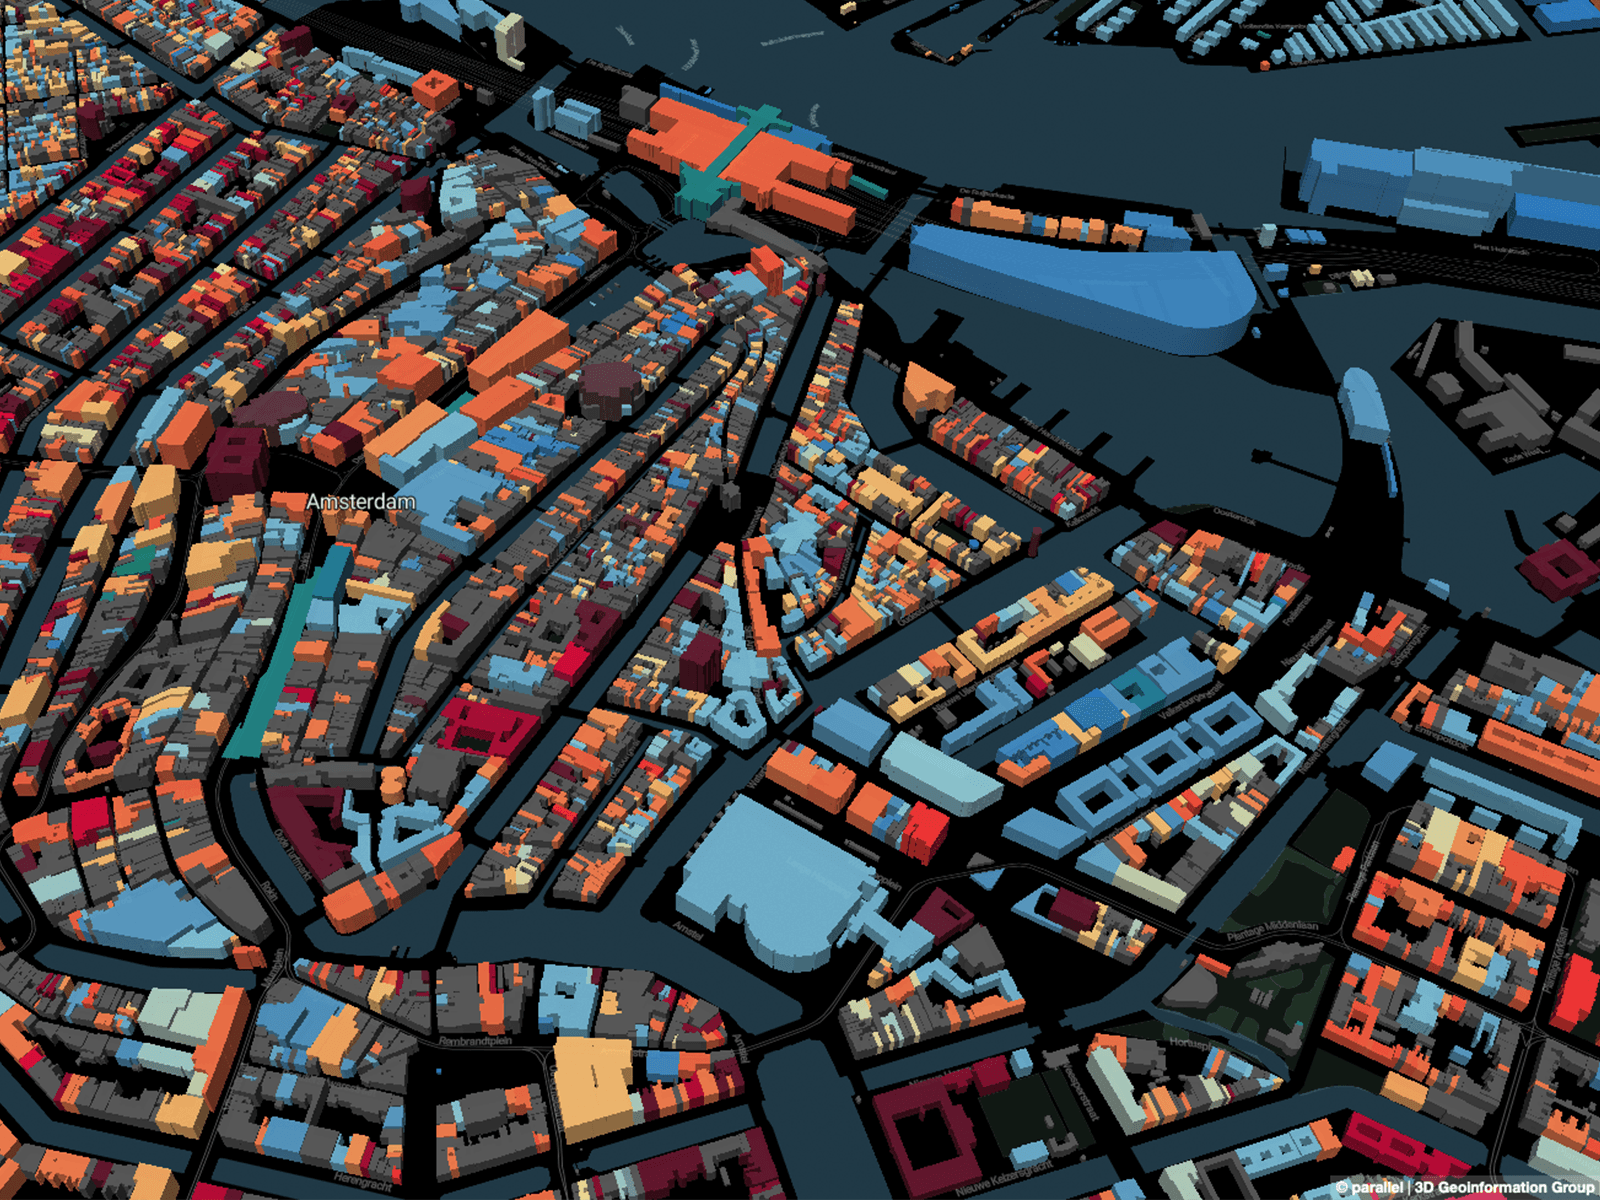
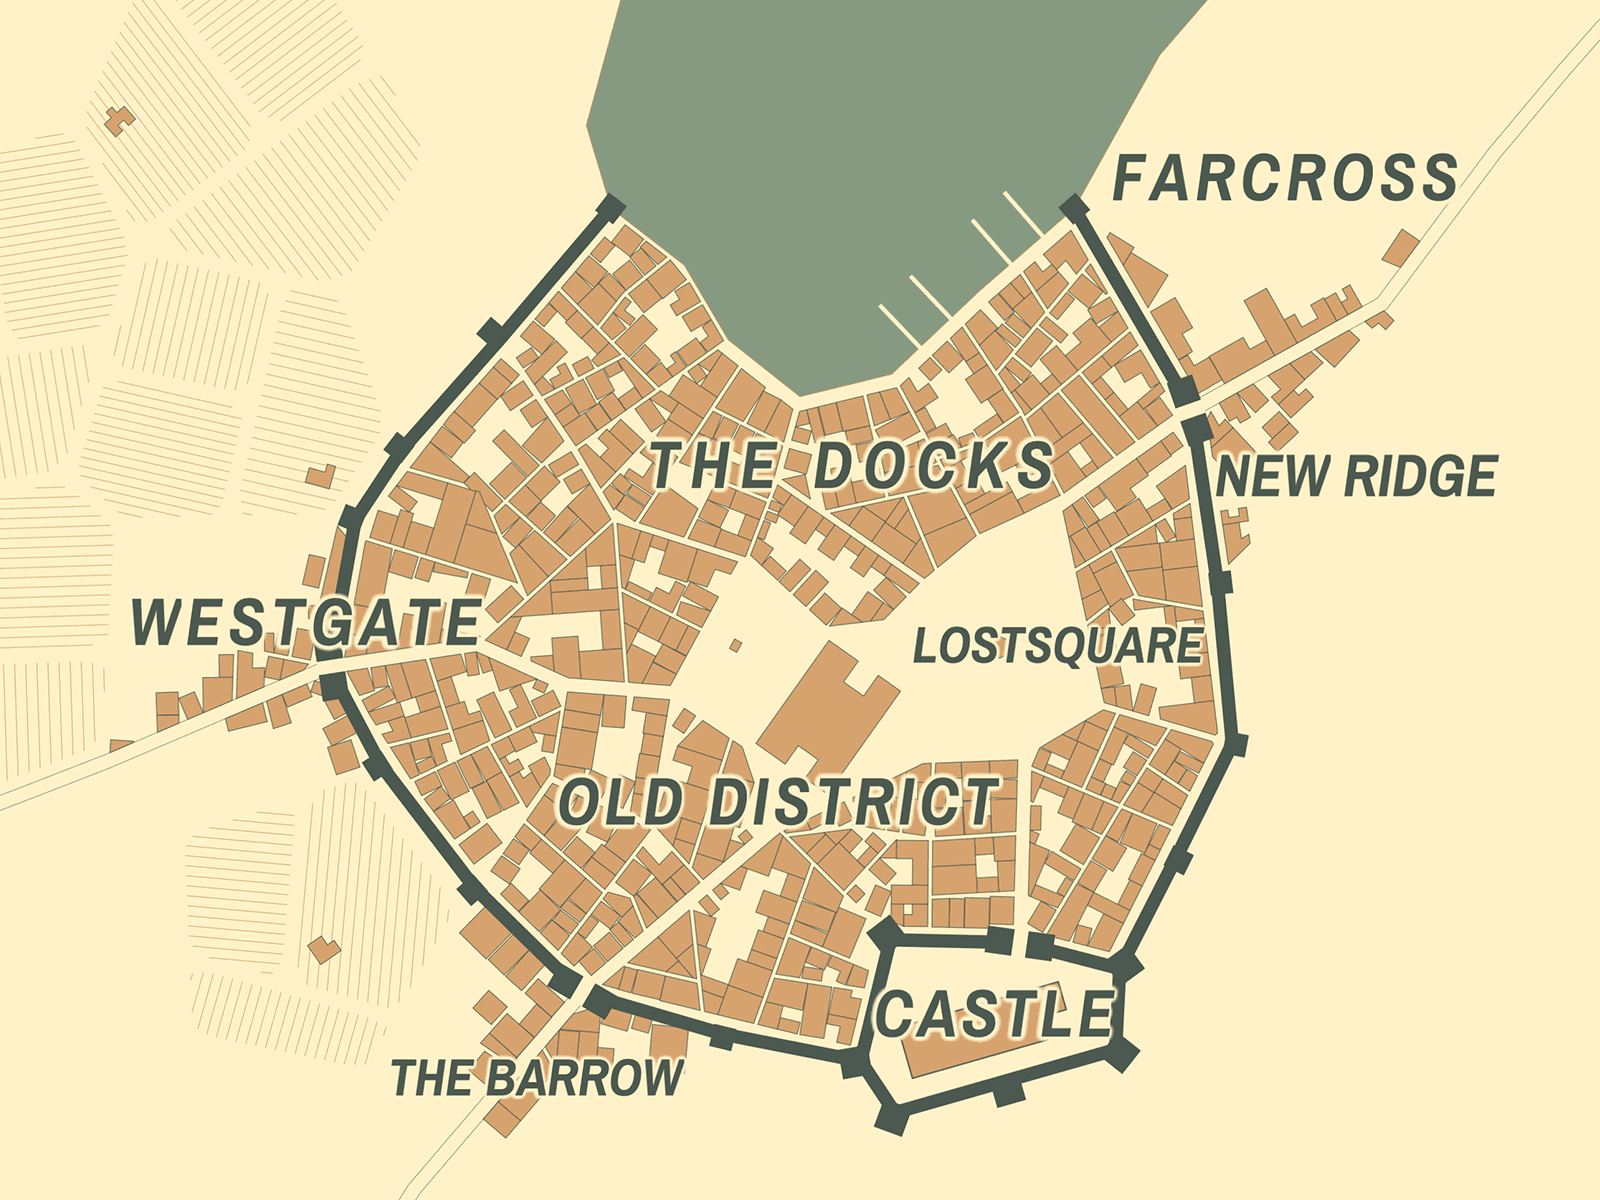
Maps are by no means objective: mapmakers leave things out, remove details, and exaggerate certain other map features. Maybe this does not matter too much when Google Maps decides to not display your favorite restaurant on the map (or does it?), but it can change the lives of people when it comes to the exact location of a county's border. Maptime #4 is about borders: what are they, what problems do they cause, and finally, how to make a geopolitical map.
Maptime #4 will start with a talk from Prof. dr. Henk van Houtum, Research Professor Geopolitics of Borders, University of Bergamo & Associate Professor Geopolitics and Political Geography of the Radboud University Nijmegen and Head of the Nijmegen Centre for Border Research (NCBR). Van Houtum will talk about borders and their role in mapmaking. Please have a look at his personal website for more information.
Next, photographer Hans van der Meer talks about his project Document Nederland 2014: The Netherlands - Belgium. Document Nederland is a yearly exhibition, commissioned by The Rijksmuseum.
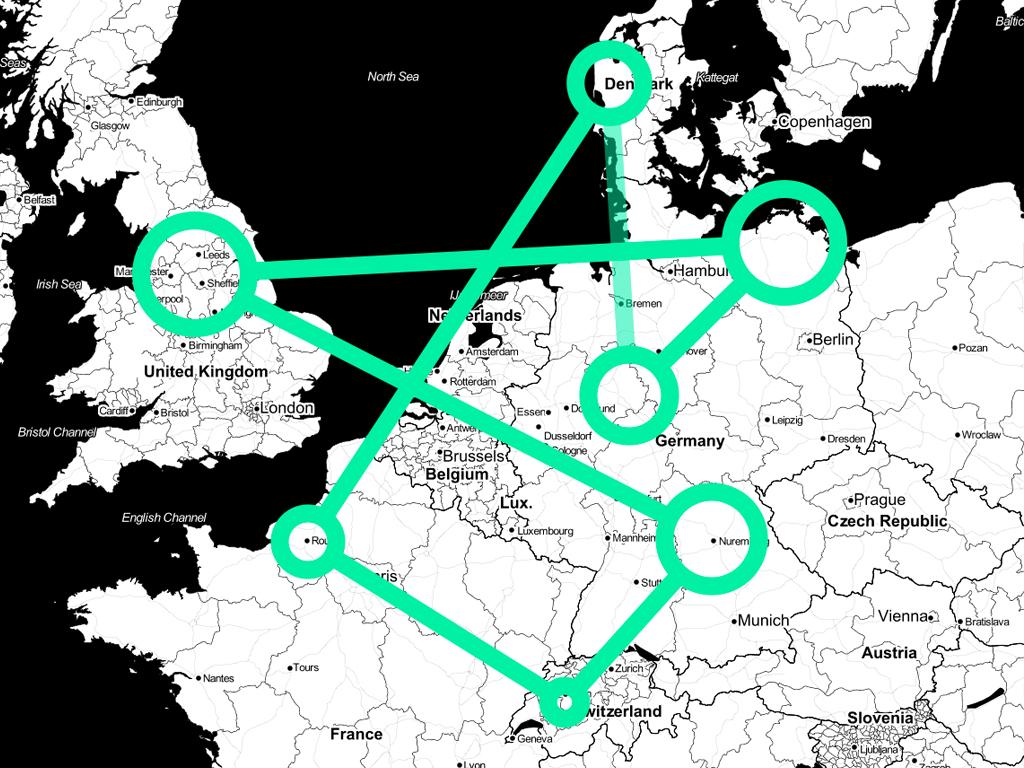
Finally, we'll work on an animated map of Europe's changing borders throughout the centuries, using D3.js. D3.js is an amazing JavaScript data visaulization library, which can also display and manipulate cartographic data. To see how powerful D3 can be, please have a look at the gallery on D3's homepage. All this power comes at a price, of course: it takes a little while to fully understand how D3 works, especially if you've never used JavaScript (or another programming language) before. For Maptime #4, I'll work on an step-by-step tutorial, to make sure everyone will be able to create a functional animating map, the tutorial will cover how to get the source data, how to export the data we need, how to create a simple HTML web page and use D3 and CSS to visualize and animate the map.
About Maptime AMS
Maptime Amsterdam is a monthly map hack night hosted at Waag. We meet once a month on a Wednesday at 18.30 to work on maps, learn about geospatial data, and teach each other the latest cartographic tools.
Maptime is, rather literally, time for mapmaking. Our mission is to open the doors of cartographic possibility to anyone interested by creating a time and space for collaborative learning, exploration, and map creation using mapping tools and technologies.
This open learning environment for all levels and degrees of knowledge offers intentional support for the beginner. Maptime is simultaneously flexible and structured, creating space for workshops, ongoing projects with a shared goal, and independent/collaborative work time.
Inspiration for Maptime comes from both hack nights and knitting circles. Both are models of spaces for people to create and learn together. Our goal is to provide this space with an open heart and without pretension. You can bring your own projects to work on, or just hang out and socialize or ask questions. Some people are experts, and some people are just getting started, but all of us are learning, so why not do it together?