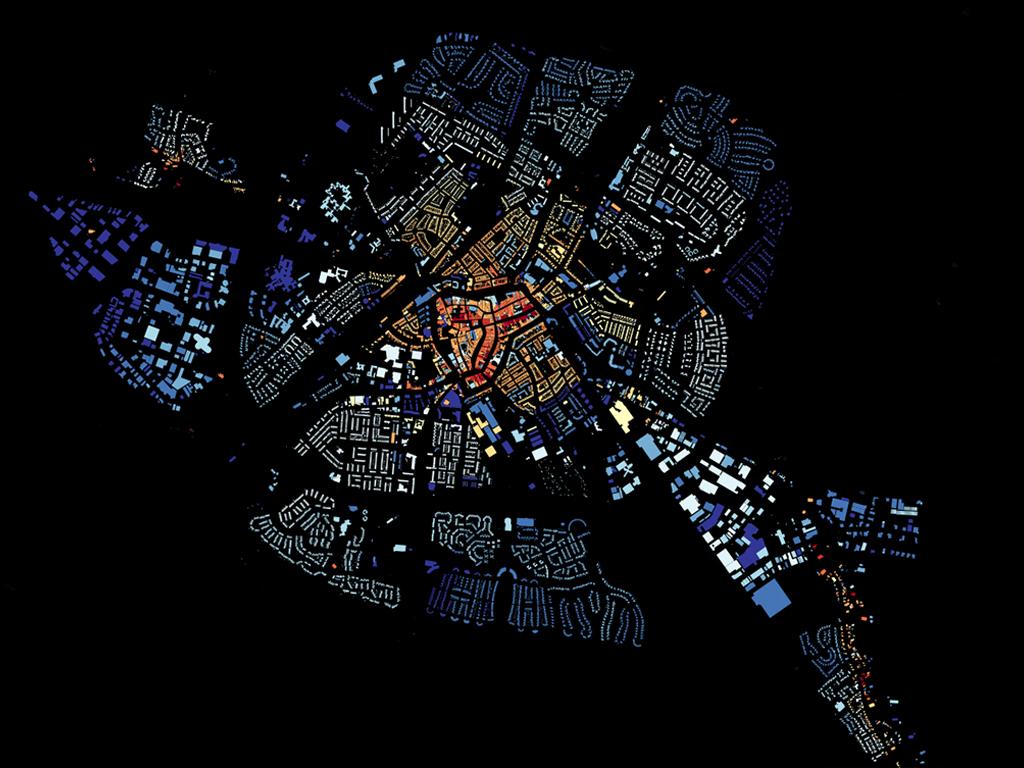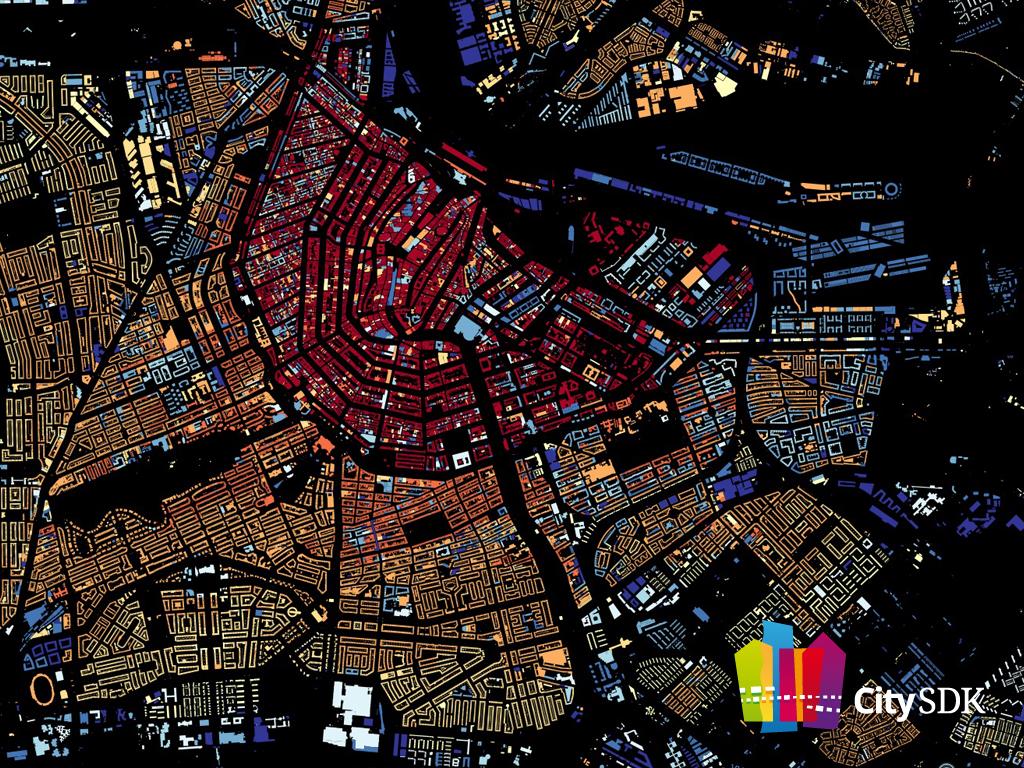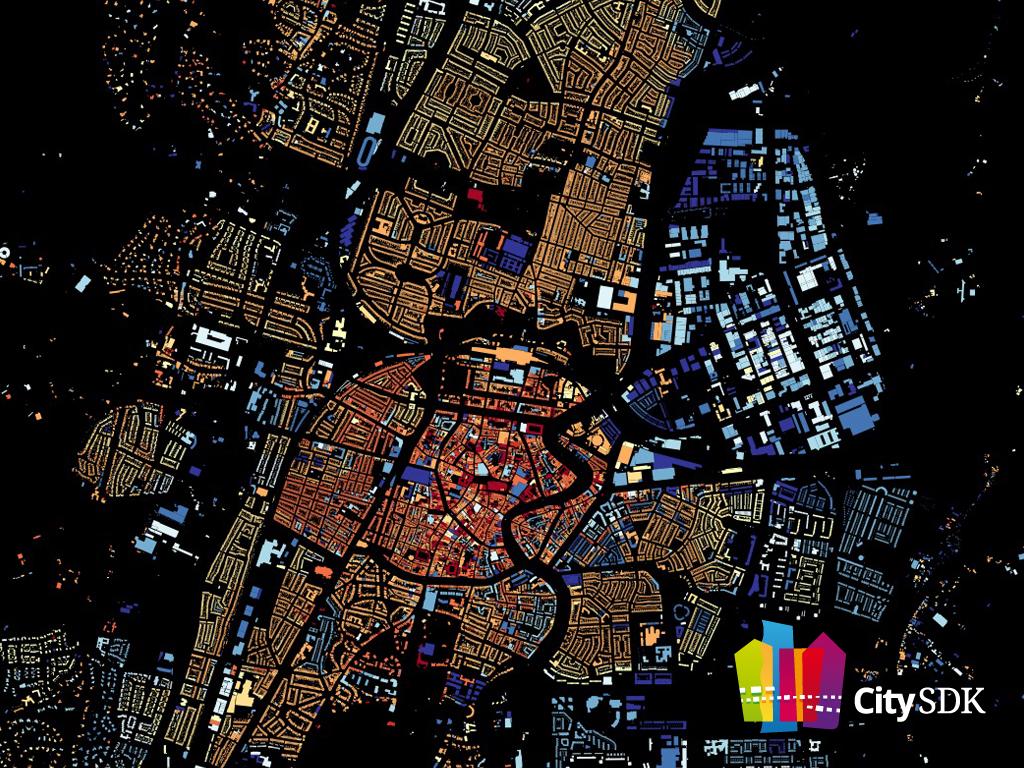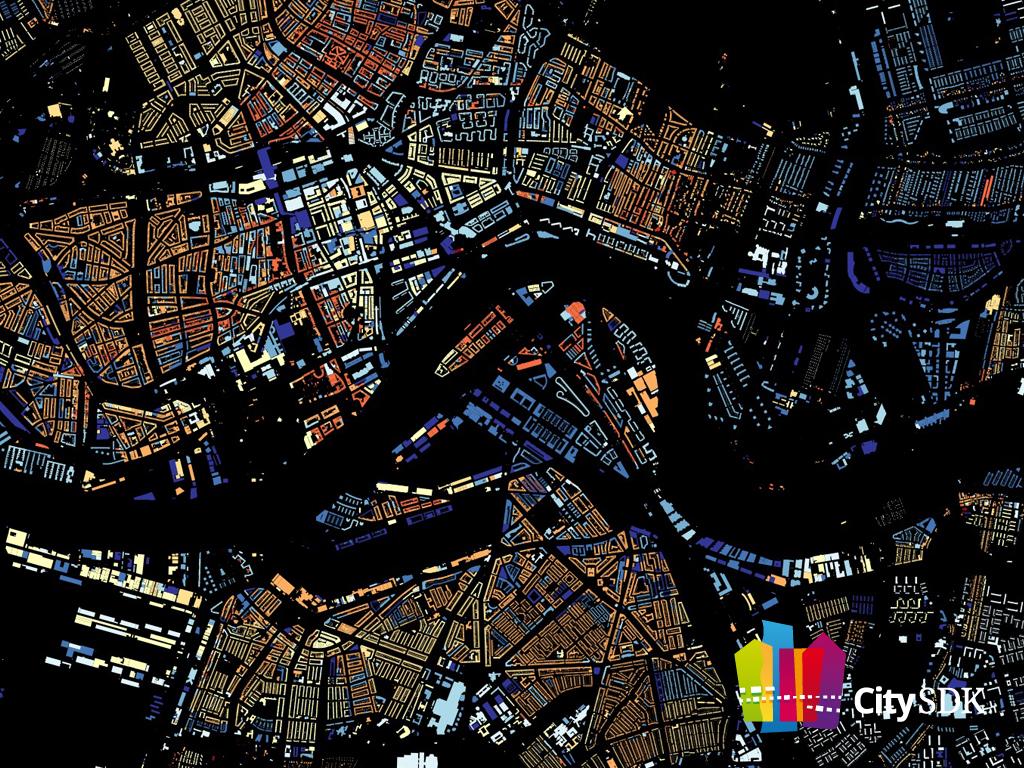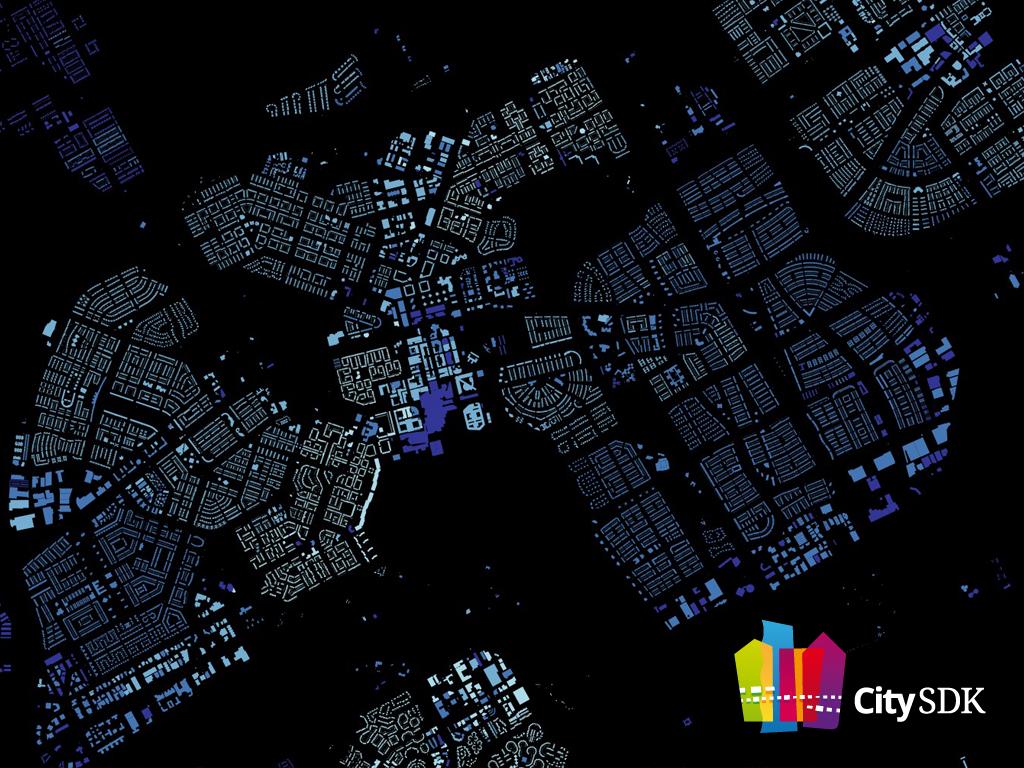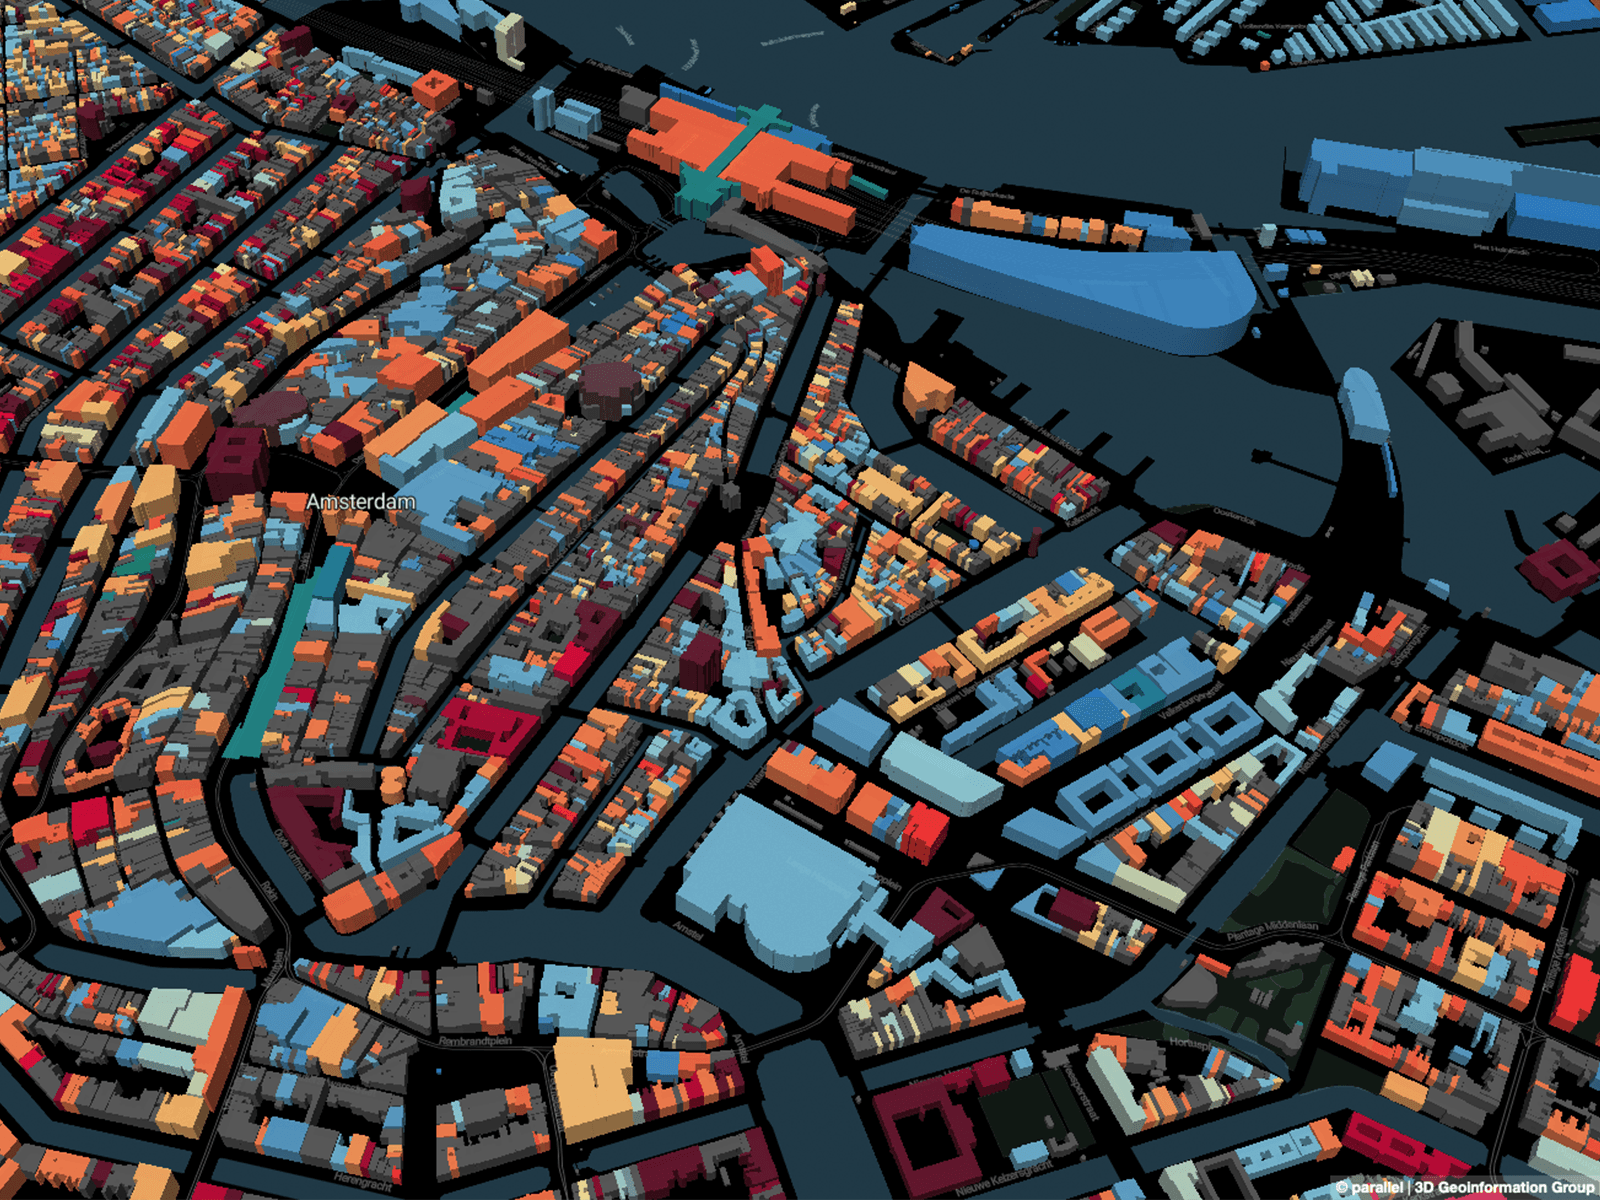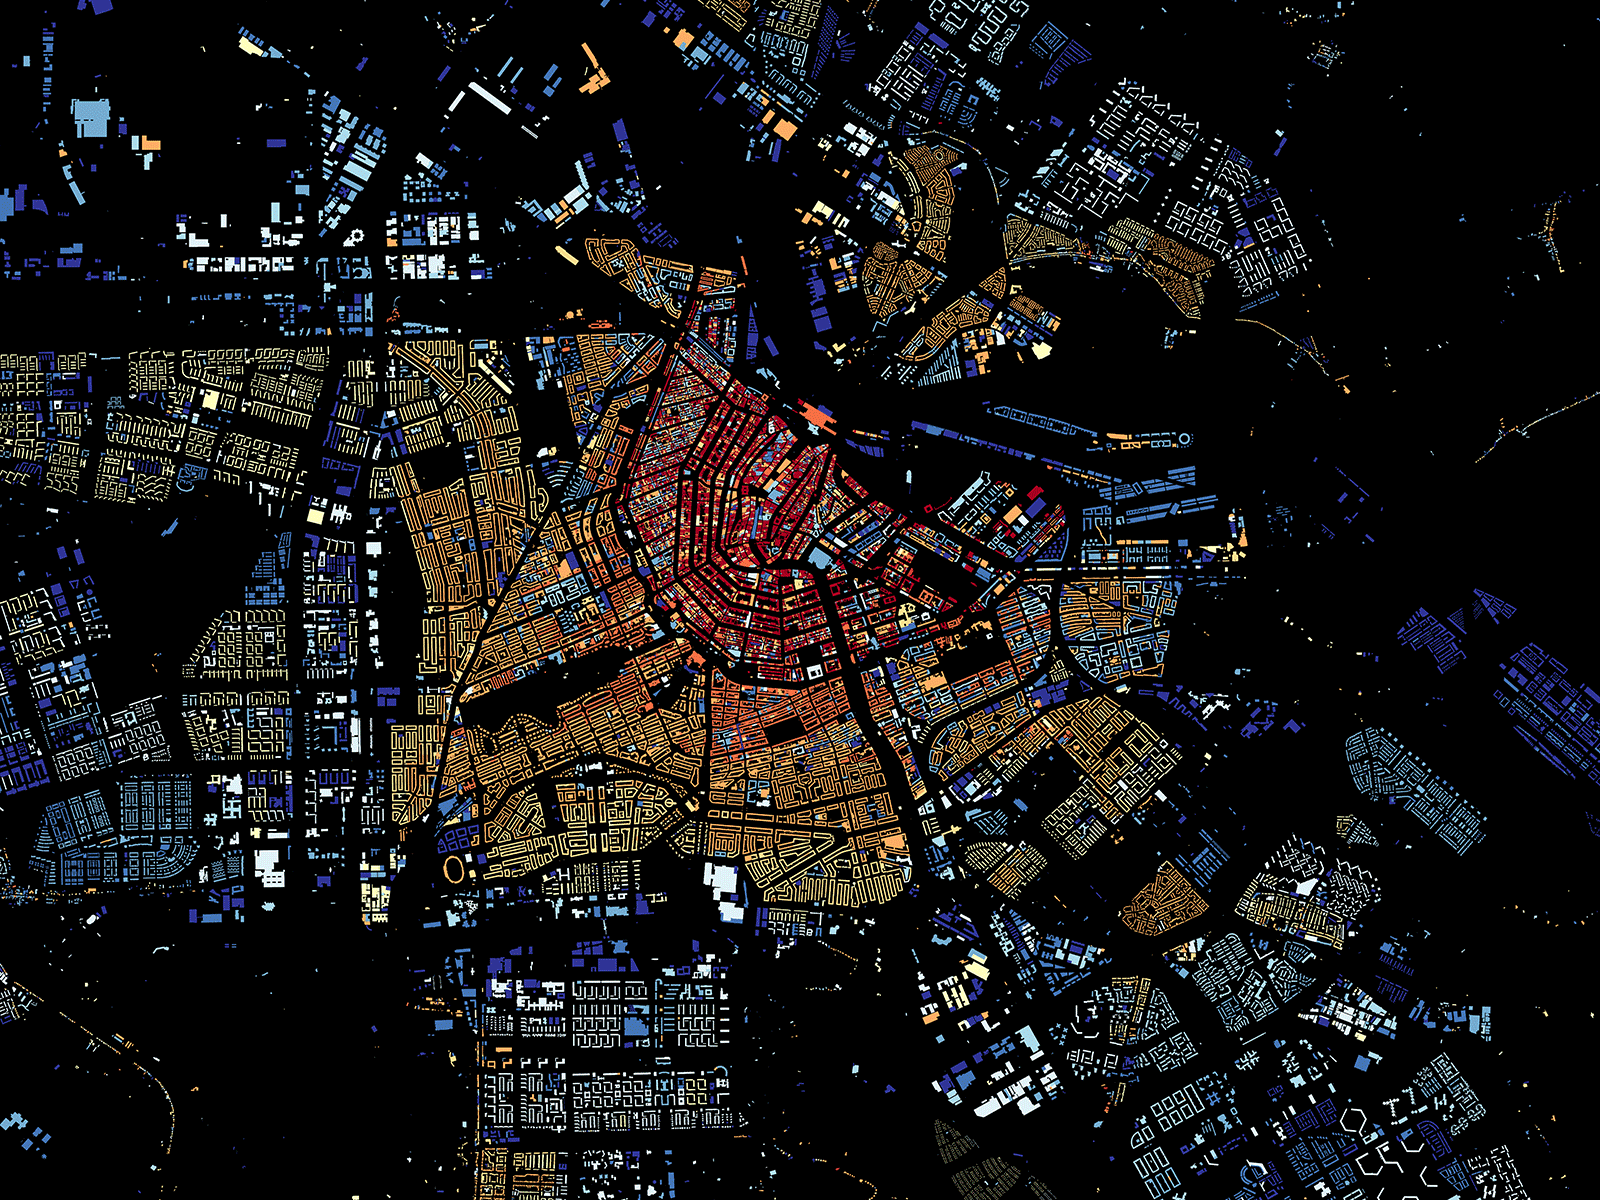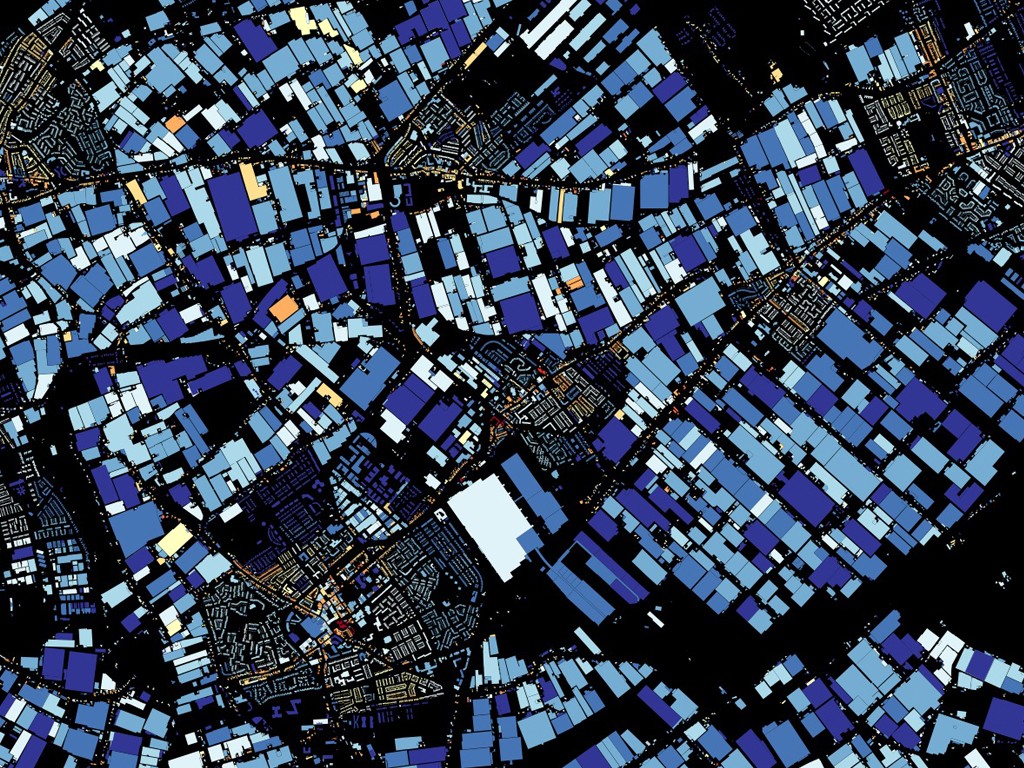
As part of the Smart CitySDK project and to demonstrate the power of open data, we developed an interactive map of all buildings in The Netherlands. This map shows the almost ten million buildings in our country, shaded according to year of construction.
Data from comes from the BAG (Register), via CitySDK. The map has been made with TileMill by Bert Spaan, Waag, inspired by BKLYNR. If you encounter incorrect building data, don't hesitate to inform the Kadaster.
The Verge wrote about this map:
Interactive map turns Dutch construction trends into epic graphics
Plotting out the 320,000-plus buildings in Brooklyn and shading them according to their year of construction was a painstaking labor of love by Thomas Rhiel. And now his idea is going even bigger. Nearly 10 million buildings in the Netherlands — 9,866,539 to be exact — have been given the same treatment. Set to a black background, the hues of red, yellow, and blue that outline buildings vary depending on how long each has been standing. Much like Brooklyn, architecture of the Netherlands is a mix of old and new, but the sheer scale here is extraordinary and something to marvel. Clicking on an individual building will display its size, function (i.e. office, school, etc.) and year it was constructed. And since the tool pulls information from a variety of sources, you'll also get details on the surrounding area like a city's name and population.
Enjoy!