A phonebook, brick, pudding mold, sieve and a silk scarf: that's what you need to get good data visualizations. At least, according to Liz Turner, one of the speakers at the first edition of ‘Big, Open & Beautiful: all about data’.
Holding the Yellow Pages, Liz starts her story. "This book is packed with useful information, but nobody will read it. Whilst it looks extremely boring, it gives me inspiration. How can I make the information in this book visible?" She dives back into her bag and pulls out a brick. "This can be seen as a part of your dataset. A building block, not very exciting. But when you combine this stone with others, something useful and meaningful arises." Next is a mold for pudding. "I brought this, because it is important to think about the form in which you want to pour all these separate elements. Ask yourself what makes sense for your target audience. What do they understand and what helps them the most?"
It almost seems as if Liz dragged along her entire kitchen, because now she pulls a sieve out of her bag. "You should always filter your data, so you get to the really good stuff. Decide which data is useful." Many questions from the audience follow on this step in the visualisation process. Because when you visualize data, you are an intermediary between the data and the recipients. You make a selection of the data and that gives you a certain power. With your choices, you decide what people know and see.
Finally Liz unties her silk scarf, which she was wearing around her neck. It portrais the steps you take in live and the design is inspired by silk scarves that soldiers used to wear. Those scarfes displayed an 'escape route', in case they were shot down in a hostile area. "Useful information, but why not also make it beautiful, fun and entertaining?"
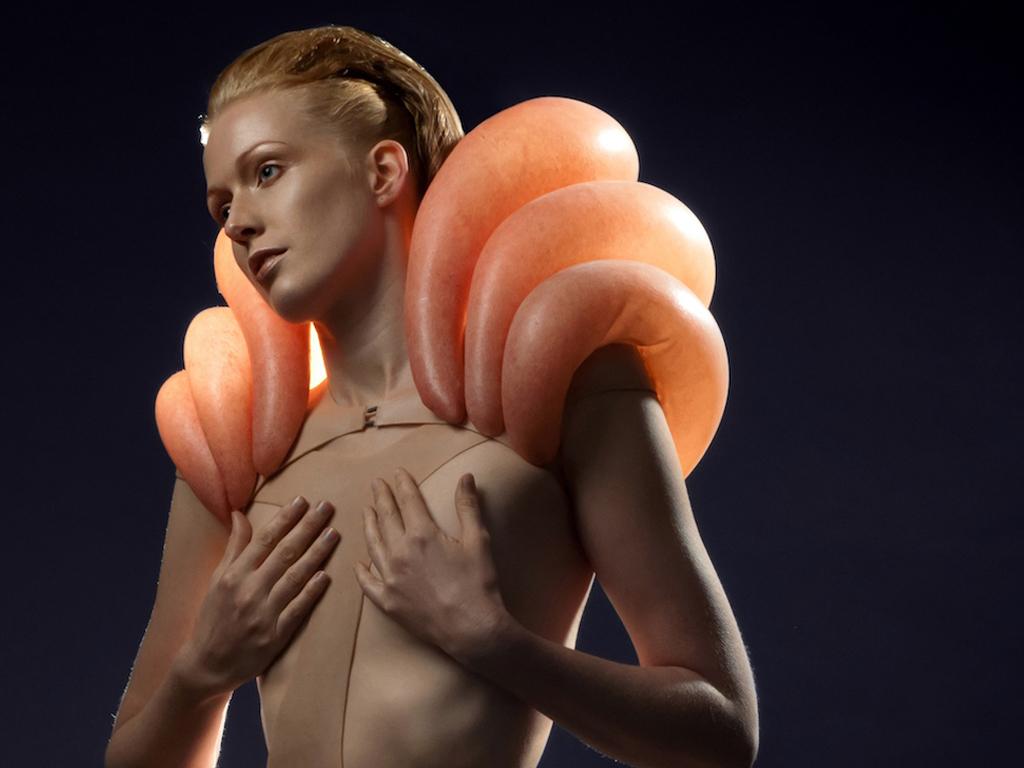
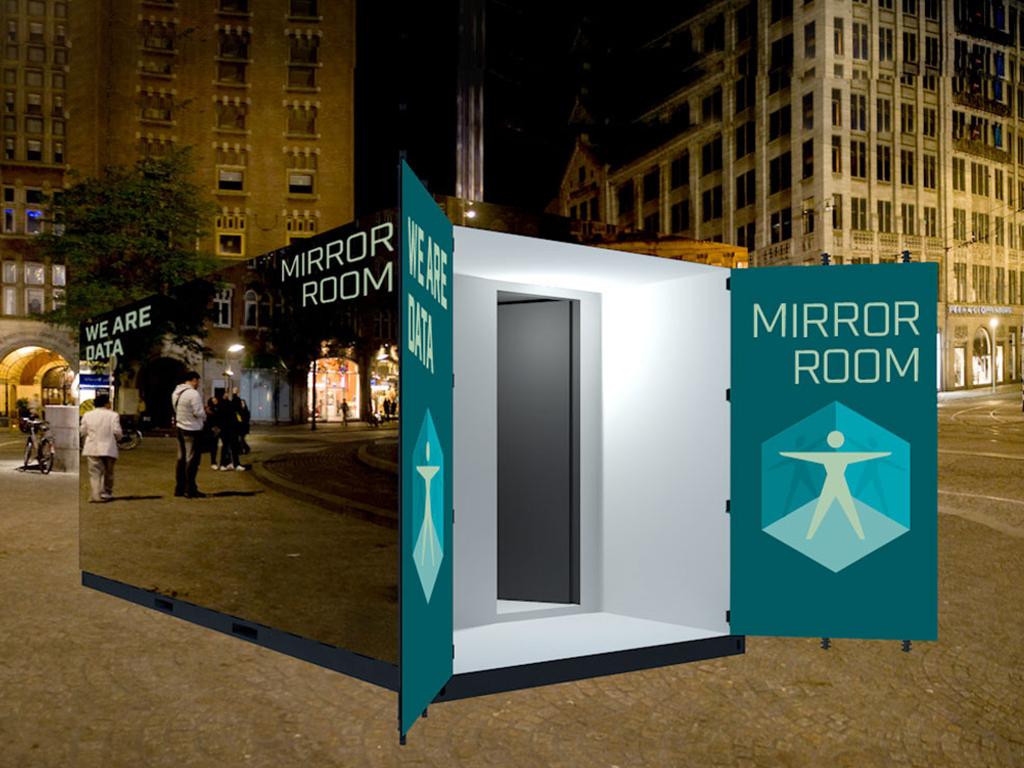
Liz shared the stage with four other speakers, each with very different backgrounds. Kay Coenen (Infographic Media) showed a number of cases. For instance the digital 3D map he made for UWV, which shows statistics of young job-seekers in the Netherlands. Laurens Schuurkamp (Waag) showed spectacular live visuals he made for the TV program The Spiral. In this project, he had to deal with data that was not yet generated. He had to visualize this data for individuals and as a communal artwork. Bert Spaan (Waag) tolled us all about Smart CitySDK, a project that focuses on the opening and reusing of mobility data: "For me, the project is successful if we create a space where data becomes visible and usable for others." Finally, Gerlinde Scholler introduced us into the world of data journalism. With her company ‘The World is a Flatland’, she translates complex stories into beautiful images and books.