Waag is known for working in various contexts with people from different backgrounds and with different occupations, supporting a more inclusive, open and co-creative way of working. To this end, over the years, we have developed many methods and exercises based on storytelling, design thinking and shared experiences that stimulate creative and open conversations needed in these contexts.
As I am leading Waag’s Co-creation Lab, a large portion of my work is dedicated to training people in co-creation and social design. Cities4People is one of the current projects in which I coach city-employees and researchers, to get to better solutions for mobility issues in their cities, together with citizens and stakeholders.
One of the methods we introduced to the project partners was ‘data-physicalisation’: a creative and playful approach to evaluate, communicate, visualize and contextualize data, in a physical, spatial context, instead of in spreadsheets or graphs.
Physicalisation can be used to share a new perspective on existing information, like studio Drift has done in their project ‘Materialism’: everyday objects have been reduced to stacks of the raw materials that they have been made of.
When you look at the Tempestry project, a collective of knitters who visualise climate data in scarfs and tapestries, the physicalisation is used to get a more personalized view of the changes in temperature on earth.
In the project LIVING MAP an actual ecosystem in the shape of the European continent was created out of a specific type of moss which can visually indicate the presence or absence of water. Precipitation data from the European Environmental Agency influenced the amount of water fed to the moss – which then visualized the change of summertime rainfall in Europe, in the future.
In two pottery projects; Life in Clay and Form Follows Data; artists physicalise their personal data in pottery, but in two different ways. For the former, personal data about the artist is superimposed in patterns onto ordinarily shaped pottery objects like teapots and bowls. The latter uses correlated forms to tell the story of the data, like the amounts of consumed coffee, physicalized in a topographic map within a coffee cup.
And these are just some examples of different forms of physicalisation.
HafenCity University’s CityScienceLab in Hamburg is one of the partners involved in Cities4People and in part responsible for the co-creation activities in Hamburg, specifically in the Altona district. Based on training and coaching Waag provided for the Hamburg-team, they invited me to host a workshop on data-physicalisation called ‘Data without digitality’ during the CityScienceSummit, which was hosted this year in Hamburg.
I started my session by presenting some of the above mentioned examples and discussed the impact of each type of form. How does a form influence the way you look at the story? There is subjectivity in each form you choose, as well as in the choice you make about the type of data you will include. So how do you make those choices? How do you know which story to tell, and which data is relevant?
Thankfully, I was supported by the HafenCity University team of Cities4People, particularly by Kimberly Tatum, who was able to share some data-sets on the placement of bike-racks in the Altona area, and large amounts of crafting materials. Armed with both data and materials we challenged the participants to come up with a physicalisation that would tell a clear story. After our discussion we only had an hour to work, and we were quite crammed with close to forty participants. But everybody managed to create something fun and informative, and there were some really great results and insights.
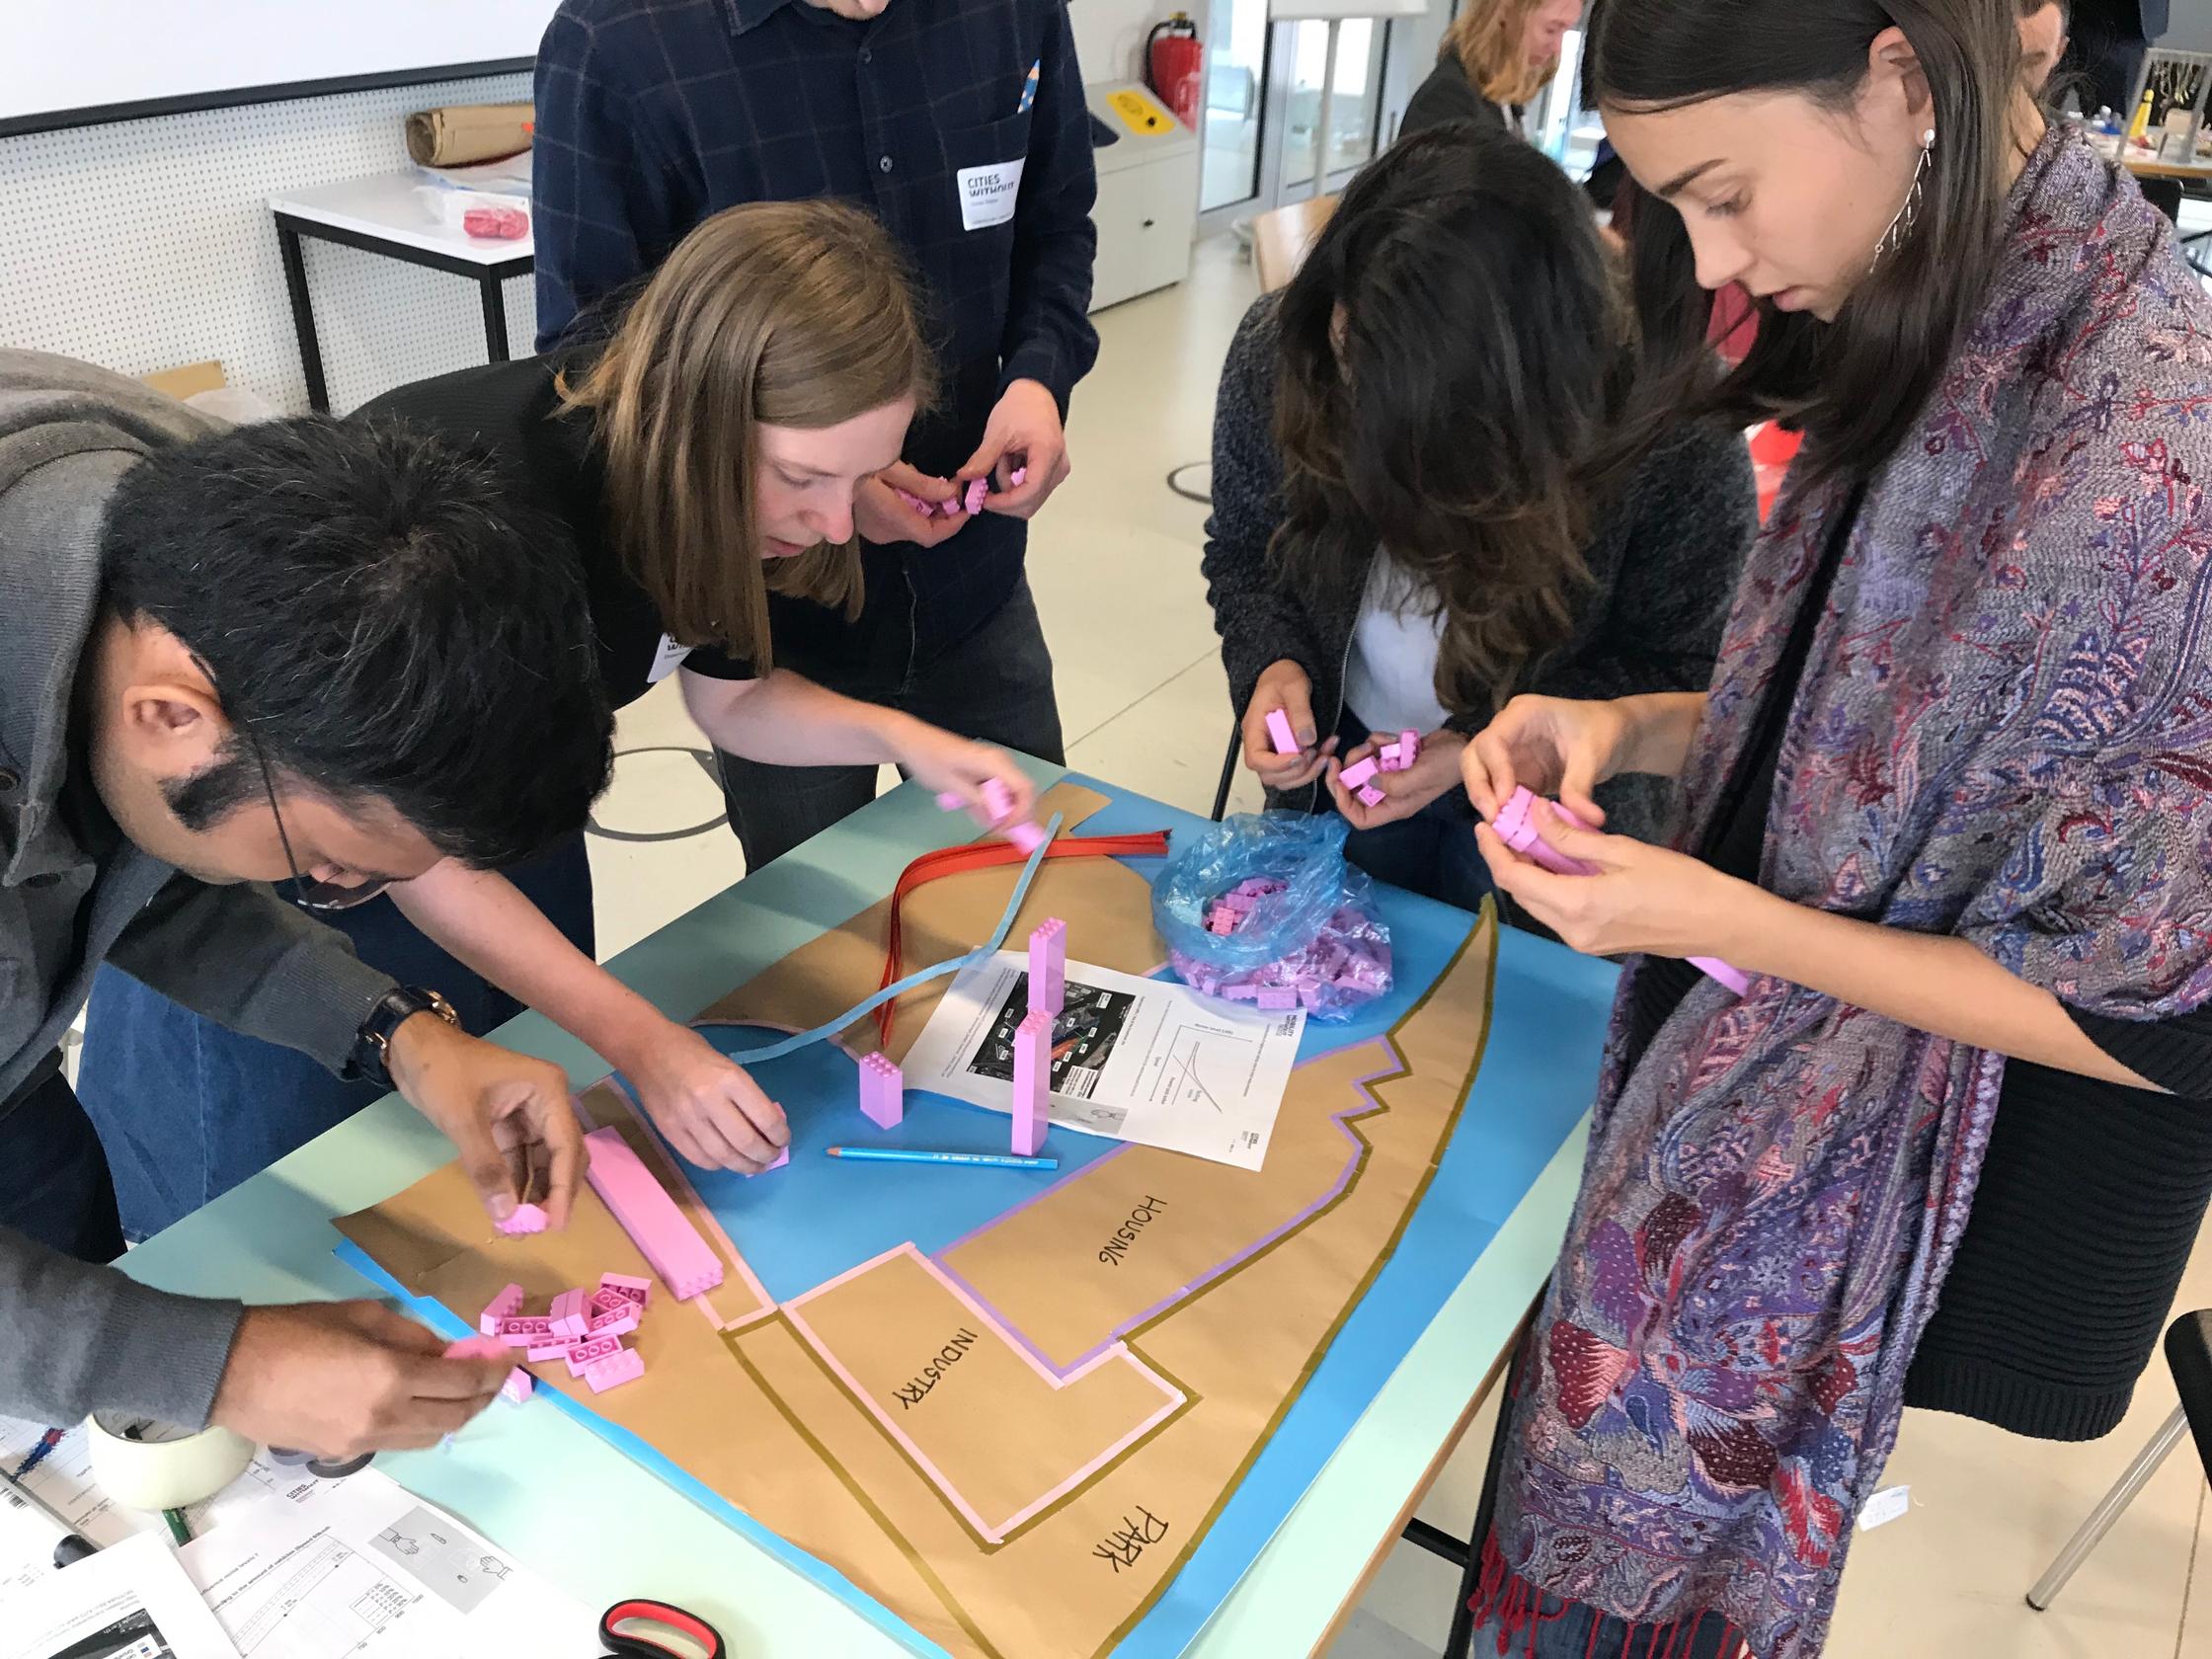
Out of the six teams, four chose to work with the data provided by the C4P-team, yet there were four completely different presentations of the same data. For example, one team developed an ingenious way of both visualizing and capturing data on location; a small ‘switchboard’ that had an on/off switch for each variable on the location. On the other end there was a team that used a performance piece, that was to be executed on location, in which people each represented a variable, to indicate the presence or lack of a specific feature. Other teams created 3D maps including Lego-structures, mobiles and other spatial visualizations to tell stories about their person interests and noise pollution in the area.
It was a chaotic, but fun session, with a lot of energy, even at the end of the conference. Many participants came to us at the end to express their enthusiasm, and share their thoughts and insights. And as an added bonus, the Hamburg-team now had four new ways to share and discuss their data in the upcoming co-creation events for the Cities4People pilots.